article thumbnail

Unlock end-to-end observability insights with Dynatrace PurePath 4 seamless integration of OpenTracing for Java

Dynatrace

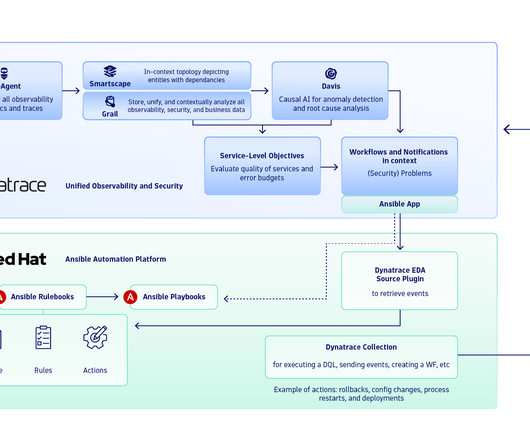
Therefore, we’re happy to announce support for OpenTracing data that’s emitted by auto- and custom-instrumentation of Java source code with Dynatrace PurePath 4, our distributed tracing and code-level analysis technology. Find OpenTracing for Java seamlessly integrated into PurePath 4. Already a Dynatrace customer?

Java 236
article thumbnail

How Java Profilers Work

DZone

One of the best tools we have today for understanding application behavior and troubleshooting performance issues are Java profilers. Java profilers monitor JVM execution at the bytecode level and can provide information on thread execution and locks, heap memory usage, garbage collection, hot methods, exceptions, class loading, and more.

Java 100
Insiders

Sign Up for our Newsletter

This site is protected by reCAPTCHA and the Google Privacy Policy and Terms of Service apply.

Trending Sources

article thumbnail

How Red Hat and Dynatrace intelligently automate your production environment

Dynatrace

Integration with Red Hat Event-Driven-Ansible will also leverage Red Hat’s flexible rulebook system to map event data, such as problem categories or vulnerability identification, to the correct job template. Dynatrace Davis AI identifies the problem and maps the configuration change event to the root cause and the correct entity.

DevOps 280
article thumbnail

Pinterest Open-Sources a Production-Ready PubSub Java Client for Kafka, Flink, and MemQ

InfoQ

Over 90% of Java applications have migrated to PSC with minimal changes. Pinterest open-sourced its generic PubSub client library, PSC, which has been heavily used in production for a year and a half. The library helped the engineering teams by increasing developer velocity, and the scalability and stability of services using it.

article thumbnail

Unit Testing Log Messages Made Easy

DZone

As a Java Developer, we need to cover a lot of scenarios to ensure the quality of our software and catch bugs as soon as possible when introducing a new code. The answer which the community provided works well, but it is a lot of boilerplate code to just assert your log events. So the LogCaptor library came into life.

Testing 360
article thumbnail

Dynatrace extends AI-powered observability for SAP together with PowerConnect

Dynatrace

Monitoring SAP products can present challenges Monitoring SAP systems can be challenging due to the inherent complexity of using different technologies—such as ABAP, Java, and cloud offerings—and the sheer amount of generated data. Any insights can be annotated and documented with the help of markdown. Architectural overview.

Java 191
article thumbnail

Dynatrace and Red Hat expand enterprise observability to edge computing

Dynatrace

Kubernetes observability Helps to understand and troubleshoot the health and performance of your MicroShift deployments and optimize resources by providing out-of-the-box alerting and anomaly detection, automated root cause analysis, as well as metrics, events, and topology in context.

Retail 261