Remove Big Data Remove Data Remove Database Remove Website
article thumbnail

Data lakehouse innovations advance the three pillars of observability for more collaborative analytics

Dynatrace

How do you get more value from petabytes of exponentially exploding, increasingly heterogeneous data? The short answer: The three pillars of observability—logs, metrics, and traces—converging on a data lakehouse. To solve this problem, Dynatrace launched Grail, its causational data lakehouse , in 2022.

Analytics 186
article thumbnail

What is cloud monitoring? How to improve your full-stack visibility

Dynatrace

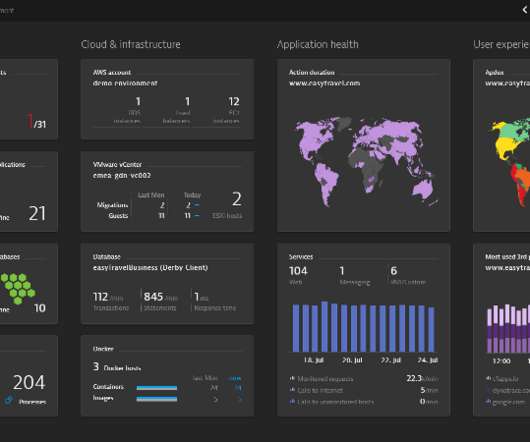
As cloud and big data complexity scales beyond the ability of traditional monitoring tools to handle, next-generation cloud monitoring and observability are becoming necessities for IT teams. With agent monitoring, third-party software collects data and reports from the component that’s attached to the agent.

Cloud 223
Insiders

Sign Up for our Newsletter

This site is protected by reCAPTCHA and the Google Privacy Policy and Terms of Service apply.

Trending Sources

article thumbnail

Driving down the cost of Big-Data analytics - All Things Distributed

All Things Distributed

Driving down the cost of Big-Data analytics. The Amazon Elastic MapReduce (EMR) team announced today the ability to seamlessly use Amazon EC2 Spot Instances with their service, significantly driving down the cost of data analytics in the cloud. However, this cannot be done without efficient, scalable data analytics.

Big Data 111
article thumbnail

What is APM?

Dynatrace

Websites, mobile apps, and business applications are typical use cases for monitoring. The variables that can impact the performance of an application vary; from coding errors or ‘bugs’ in the software, database slowdowns, hosting and network performance, to operating system and device type support. From APM to full-stack monitoring.

article thumbnail

A guide to Autonomous Performance Optimization

Dynatrace

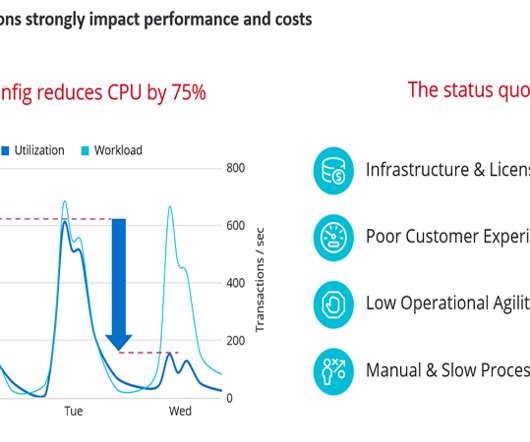
Stefano started his presentation by showing how much cost and performance optimization is possible when knowing how to properly configure your application runtimes, databases, or cloud environments: Correct configuration of JVM parameters can save up to 75% resource utilization while delivering same or better performance!

article thumbnail

What is Application Performance Monitoring?

Dynatrace

Websites, mobile apps, and business applications are typical use cases for monitoring. The variables that can impact the performance of an application vary; from coding errors or ‘bugs’ in the software, database slowdowns, hosting and network performance, to operating system and device type support. From APM to full-stack monitoring.

article thumbnail

Why test data management is more important than you think

Testsigma

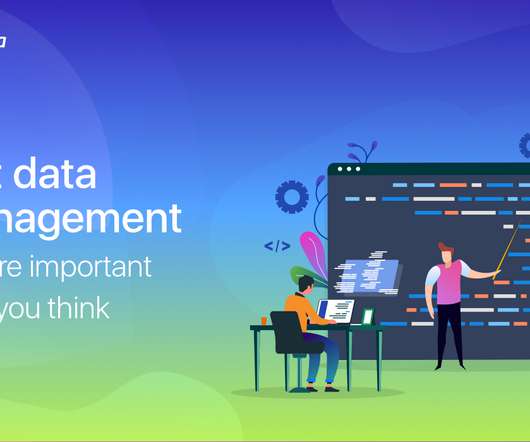
IBM Big Data and Analytics Hub website cited a case study, where a US insurance company was estimating 15% of their testing efforts to be just test data collection for the backend system and the frontend system. The test data management for the company had become a big problem and had to be solved.

Testing 60