

Kubernetes Observability: Code Profiling With Flame Graphs
Percona
OCTOBER 12, 2023
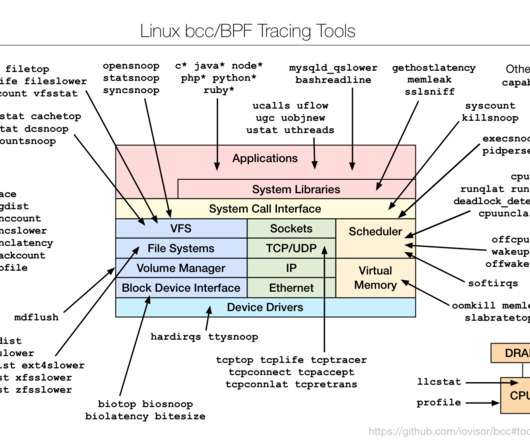
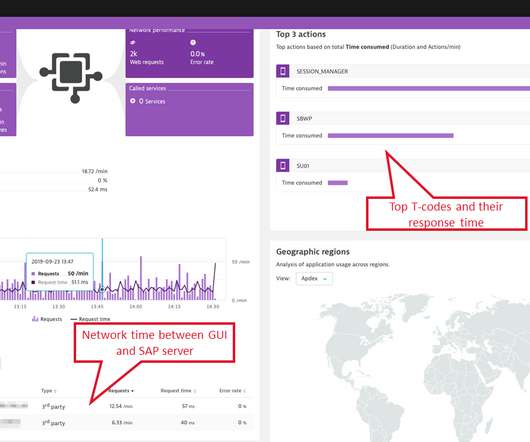
It shows which code paths are more busy on the CPU in given samples. An example of a flame graph can be found below: Each box is a function in the stack, and wider boxes mean more time the system was busy on CPU on these functions. An example is kubectl-flame ( [link] ). ✔ Launching profiler. ✔ Profiling.


Let's personalize your content