article thumbnail

Performance Tuning Java Applications in Linux

DZone

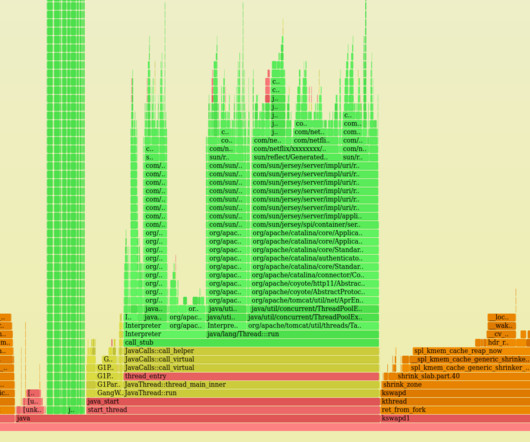
Learn how to make your Java applications performance perfectly. You may also like: How to Properly Plan JVM Performance Tuning. While Performance Tuning an application both Code and Hardware running the code should be accounted for. Reduce the amount of code in critical sections. Thread Contention.

Java 147
article thumbnail

Unleash Peak Performance in Java Applications: Overview of Profile-Guided Optimization (PGO)

DZone

In the realm of Java development, optimizing the performance of applications remains an ongoing pursuit. Profile-Guided Optimization (PGO) stands as a potent technique capable of substantially enhancing the efficiency of your Java programs.

Java 177
Insiders

Sign Up for our Newsletter

This site is protected by reCAPTCHA and the Google Privacy Policy and Terms of Service apply.

Trending Sources

article thumbnail

Write Optimized Spark Code for Big Data Applications

DZone

PySpark is the Python API for Apache Spark , which allows Python developers to write Spark applications using Python instead of Scala or Java. In addition, pySpark applications can be tuned to optimize performance and achieve better execution time, scalability, and resource utilization.

Big Data 161
article thumbnail

Unlock end-to-end observability insights with Dynatrace PurePath 4 seamless integration of OpenTracing for Java

Dynatrace

Cloud-native technologies and microservice architectures have shifted technical complexity from the source code of services to the interconnections between services. Deep-code execution details. You get code-level insights into application code without code changes. Dynatrace news. The app is powered by Kubernetes.

Java 242
article thumbnail

How to fine tune failure detection

Dynatrace

Automatic failure detection works well in most cases especially for web services and when developers follow good coding practices. It is basically an exception which the code doesn’t expect to occur and therefore doesn’t deal with. For instance, if I expect a “dataValidationException”, the code would look like this: Try. {.

Tuning 116
article thumbnail

Kubernetes Observability: Code Profiling With Flame Graphs

Percona

It shows which code paths are more busy on the CPU in given samples. The documentation mentions that the supported languages to profile are Go, Java (any JVM-based language), Python, Ruby, and NodeJS. In this blog post, we’ll review how to run Linux profilers such as perf and produce flame graphs on Kubernetes environments.

Code 110
article thumbnail

Understand and replay Android app crashes with Session Replay

Dynatrace

This includes selecting the app to be instrumented, fine-tuning cost controls, and enabling users to opt-in to Session Replay recording. Another nifty Session Replay feature is the ability to capture custom events—events that are not typically captured by default—irrespective of whether the codebase is Java or Kotlin. Get started.