article thumbnail

What is? OpenTelemetry??An open-source standard for logs, metrics, and traces

Dynatrace

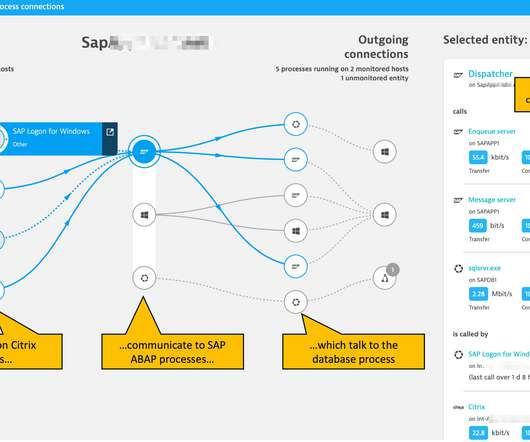
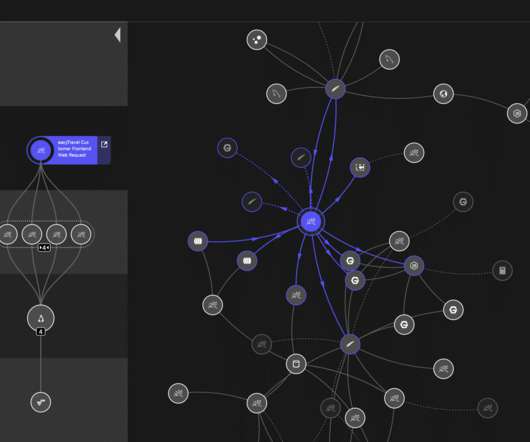
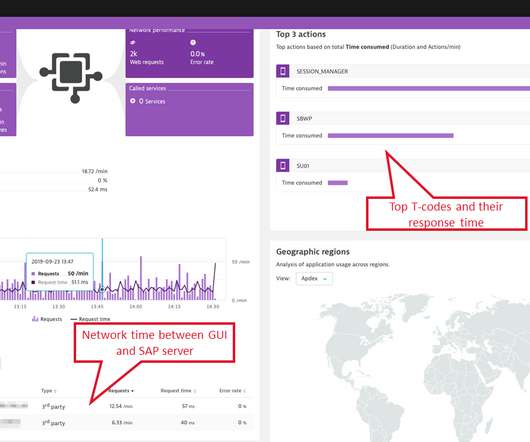
Loosely defined, observability is the ability to understand what’s happening inside a system from the knowledge of the external data it produces, which are usually logs, metrics, and traces. Logs, metrics, and traces make up the bulk of all telemetry data. The data life cycle has multiple steps from start to finish.

article thumbnail

Introducing Davis data units (DDUs) for increased flexibility with custom metrics

Dynatrace

Metrics are an essential functionality provided by the Dynatrace Software Intelligence Platform. Dynatrace OneAgent and ActiveGate extensions provide you with a multitude of metrics. We also empower you with the ability to ingest your own custom metrics and leverage those metrics using a variety of Dynatrace features.

Metrics 147
Insiders

Sign Up for our Newsletter

This site is protected by reCAPTCHA and the Google Privacy Policy and Terms of Service apply.

Trending Sources

article thumbnail

Integrate Dynatrace more easily using the new Metrics REST API

Dynatrace

As a full stack monitoring platform, Dynatrace collects a huge number of metrics for each OneAgent monitored host in your environment. Depending on the types of technologies you’re running on your individual hosts, the average number of metrics is about 500 per computational node. New metric identifiers and structure.

Metrics 102
article thumbnail

Dynatrace Managed release notes version 1.230

Dynatrace

This eliminates certain timeout issues with Windows Server 2019 at boot. Custom events for alerting using the Build tab and advanced query mode now apply the same metric dimension limits that are applied to Code -tab-based configurations. Local self-monitoring metrics. More details will come in a separate blog post, shortly.

Metrics 207
article thumbnail

Dynatrace OTel Collector distribution amplifies OpenTelemetry integration for scalable, production-ready observability

Dynatrace

Likewise, the OpenTelemetry Project Journey Report states that more than 9,000 contributors and 1,100 companies have contributed to OpenTelemetry since the project’s inception in 2019. Users can also filter telemetry data for all signals (traces, metrics, and logs). Dynatrace is among the project’s top contributors.

article thumbnail

Percona Database Performance Blog 2018 Year in Review: Top Blog Posts

Percona

Let’s look at some of the most popular Percona Database Performance Blog posts in 2018. With the Percona Database Performance Blog, Percona staff and leadership work hard to provide the open source community with insights, technical support, predictions and metrics around multiple open source database software technologies.

article thumbnail

Leading Financial Services Provider Decreases Spend While Increasing Customer Satisfaction Using Flow Metrics 

Tasktop

By adopting value stream management practices, including Flow Metrics, and leveraging insights from Planview Tasktop Viz, this company turned the tides, reducing Flow Time by 70%, improving quality, and leaving customers much happier. The financial services provider focused their attention on three Flow Metrics in Planview Tasktop Viz: .

Metrics 52