Remove tags happiness
article thumbnail

Answer-driven release validation with Dynatrace SaaS Cloud Automation

Dynatrace

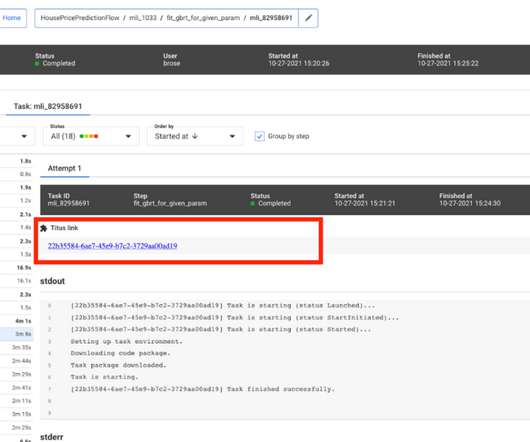
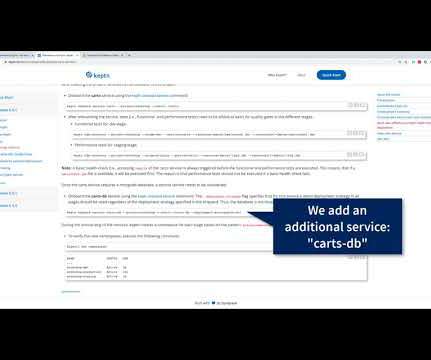
Now we’re happy to announce the release of Cloud Automation quality gates. Once your Cloud Automation control plane has been activated you can easily tag any service for evaluation by adding the following two tags to it: Key: keptn_managed. Following the evaluations, the results are logged in Dynatrace as events.

Cloud 243
article thumbnail

Automate your monitoring orchestration with the new Environment API (Early Adopter)

Dynatrace

We’re happy to announce that the new Environment API is now available in the Cluster API in an Early Adopter release. Easily manage environments by tagging, sorting, and filtering. To make discoverability and referencing environments more flexible, the new API supports tagging. For more flexibility, use tags instead.

Insiders

Sign Up for our Newsletter

This site is protected by reCAPTCHA and the Google Privacy Policy and Terms of Service apply.

Trending Sources

article thumbnail

Managing a few Azure nodes is easy, managing observability for thousands is unique to Dynatrace

Dynatrace

Now we’re happy to announce that you can set conditions for defining management zones that are specific to Azure entities: Azure management group ID. Azure tags. Define visibility and responsibility for monitoring data based on Azure tags. Azure management group name. Azure name. Azure subscription UUID. Azure tenant UUID.

Azure 165
article thumbnail

Getting Your `head` Straight: A New CSS Performance Diagnostics Snippet

Smashing Magazine

And that is mostly related to the order of how assets are loaded in the <head> As Harry says, “I spend a lot of my time looking through clients’ <head> tags to ensure everything in there is in the best possible shape it can be. Happy debugging, everyone! The tool in action. Large preview ). Large preview ).

article thumbnail

Dynatrace simplifies StatsD, Telegraf, and Prometheus observability with Davis AI

Dynatrace

We’re happy to announce that by opening up Dynatrace OneAgent for integration of custom metrics, Dynatrace has automated alerting on crucial metrics and removes the need to maintain local configurations for StatsD, Telegraf, and Prometheus—even in the largest of environments, which can include hundreds of thousands of instances and containers.

article thumbnail

Boost application performance with improved CPU analysis across all your deep-monitored workloads

Dynatrace

We’re happy to announce that with Dynatrace version 1.198, we’ve dramatically improved CPU analysis, allowing you to easily understand CPU consumption over time, in the context of your workloads. The improved filter bar allows you to search for workloads by name, tags, or technology.

article thumbnail

Open-Sourcing a Monitoring GUI for Metaflow

The Netflix TechBlog

After countless iterations, we are finally very happy with the outcome, which we have now used in production for a few months. They can also tag their runs and filter the view by tags, allowing them to focus on particular subsets of experiments. Naturally, the view can be grouped by user.