Remove tag visual-meetings
article thumbnail

Upgrade to the Data explorer to level up your data visualizations and analysis

Dynatrace

And so, getting simple visualization use cases done efficiently becomes far from the norm. When looking at the market, we see the following shortcomings of solutions: They’re either good at automated analytics , using AI engines, or at providing visualization/ dashboarding capabilities, but not both.
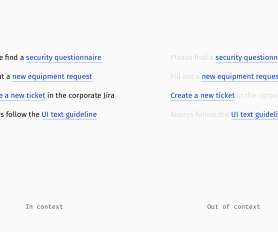
Metrics 225
article thumbnail

Digital Business Analytics: Accelerating your dashboard journey

Dynatrace

Then, you’d have a meeting to review the requirements, before researching how to access and transform data, to then build a mockup dashboard. Once completed, you’d then need to schedule another meeting to review the mockup dashboard and get approvals. Teams need data visualized in different ways so they can make informed decisions.

Analytics 169
Insiders

Sign Up for our Newsletter

This site is protected by reCAPTCHA and the Google Privacy Policy and Terms of Service apply.

Trending Sources

article thumbnail

Revolutionize Your Web Presence: Explore The Potential Of WordPress Page Builders!

Official Blog - World Web Technology

It helps users to create visually appealing and functional websites efficiently and quickly. Top-Notch User Experience: WordPress website development improves user experience with visually appealing designs and intuitive navigation. You can create visually appealing and dynamic websites. It removes the need for coding knowledge.

Website 59
article thumbnail

A practical guide to monitoring Python Applications with Dynatrace

Dynatrace

Whether these are open-source developers I meet through my work on the CNCF project Keptn or Dynatrace partners and customers who I try to help get the most out of their investment in our Software Intelligence platform. Dynatrace tagging tips. which can be used for automated tagging and naming. Step 3: Analyze your data.

article thumbnail

Don’t Sink Your Website With Third Parties

Smashing Magazine

Simon Hearne , an independent web performance consultant and one of the co-organizers of the London Web Performance Group , maintains an online Request Map tool that uses WebPageTest to get the data and Ghostery to visualize it. Continue reading below ↓ Meet “TypeScript in 50 Lessons” , our shiny new guide to TypeScript.

Website 131
article thumbnail

Optimize mobile app performance, adoption, and conversions with Session Replay and business analytics

Dynatrace

How do I solve issues quickly while meeting every regional data privacy regulation? Session Replay for mobile allows you to visually replay crashed mobile user sessions with HD movie-like quality, so teams can see the real experience from the user’s perspective.

Analytics 203
article thumbnail

Dynatrace OpenPipeline: Stream processing data ingestion converges observability, security, and business data at massive scale for analytics and automation in context

Dynatrace

Organizations need to ensure their solutions meet security and privacy requirements through certified high-performance filtering, masking, routing, and encryption technologies while remaining easy to configure and operate. OpenPipeline contextualizes data in real time with enrichment, discovered topology, and tags.

Analytics 192