article thumbnail

Accelerate resolution of network issues with AI-powered event reporting based on SNMP traps

Dynatrace

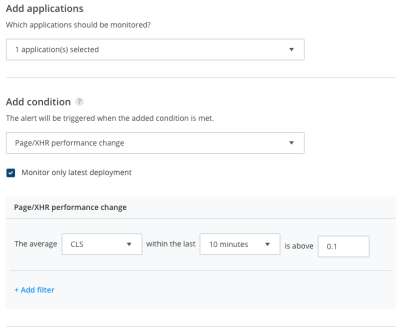
The volume of data and events grows in tandem with the rising complexity of IT infrastructure. While SNMP allows you to query monitored devices for performance information, SNMP traps are used to proactively report certain types of events. These can range from routine state transition events to critical problem reports.

Network 229
article thumbnail

In Defence of DOM­Content­Loaded

CSS Wizardry

I never thought I’d write an article in defence of DOMContentLoaded , but here it is… For many, many years now, performance engineers have been making a concerted effort to move away from technical metrics such as Load , and toward more user-facing, UX metrics such as Speed Index or Largest Contentful Paint. Or are they…?

Metrics 326
Insiders

Sign Up for our Newsletter

This site is protected by reCAPTCHA and the Google Privacy Policy and Terms of Service apply.

Trending Sources

article thumbnail

New web performance insights with additional metrics and enhanced Visually complete for synthetic monitors

Dynatrace

Recently introduced improvements to Visually complete and new web performance metrics for Real User Monitoring are now available for Synthetic Monitoring as well. Ensure better user experience with paint-focused performance metrics. These metrics are tightly connected to the perceived load speed of your application.

Metrics 220
article thumbnail

Enhance data management with Grail: Ultimate guide to custom buckets and security policies

Dynatrace

Table name Default bucket logs default_logs events default_events metrics default_metrics bizevents default_bizevents dt.system.events dt_system_events entities spans (in the future) The default buckets let you ingest data immediately, but you can also create additional custom buckets to make the most of Grail.

article thumbnail

Beyond Speed: Why You Should Be Tracking Interactive Metrics

Rigor

In the past, the answer would be based on the load time of a page, but over the years, we have evolved our approach to site speed to incorporate new metrics, alone or in combination with existing metrics. The next evolution of performance brought in paint metrics. This is where so-called interactivity metrics come in.

Metrics 71
article thumbnail

AI techniques enhance and accelerate exploratory data analytics

Dynatrace

Challenges to exploratory data analytics Among the challenges analysts face are multiple heterogeneous data sources, noisy or incomplete data, insufficient causal reasoning (faulty connections between event cause and effect), and untrustworthy AI , according to an article from the Columbia University Data Science Institute.

Analytics 215
article thumbnail

How platform engineering and IDP observability can accelerate developer velocity

Dynatrace

The pair showed how to track factors including developer velocity, platform adoption, DevOps research and assessment metrics, security, and operational costs. Furthermore, OneAgent observes and gathers all remaining workload logs, metrics, traces, and events.