Remove Event Remove Metrics Remove Speed Remove Traffic
article thumbnail

AI techniques enhance and accelerate exploratory data analytics

Dynatrace

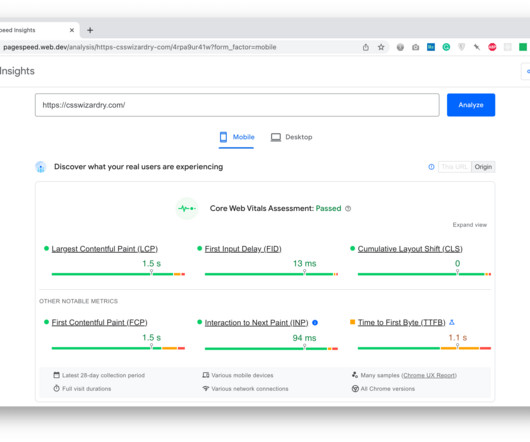
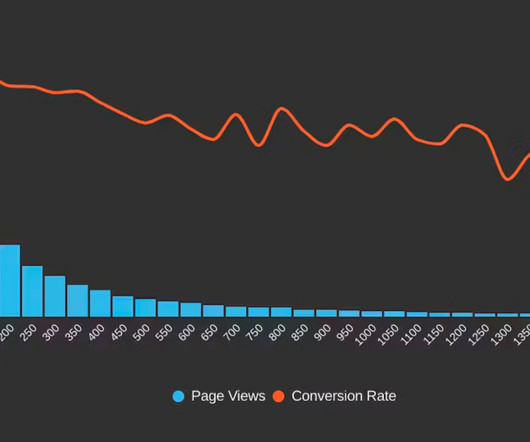
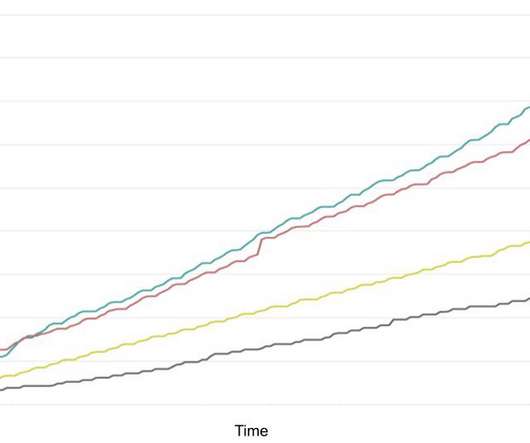
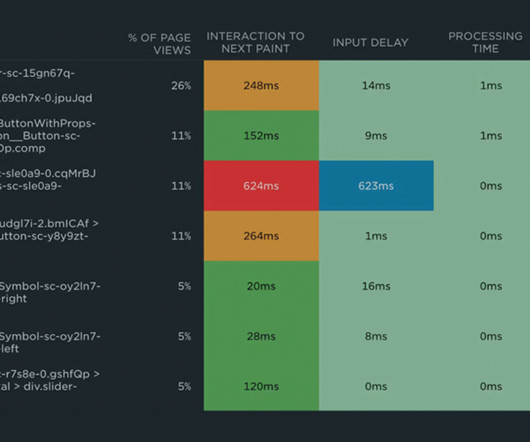
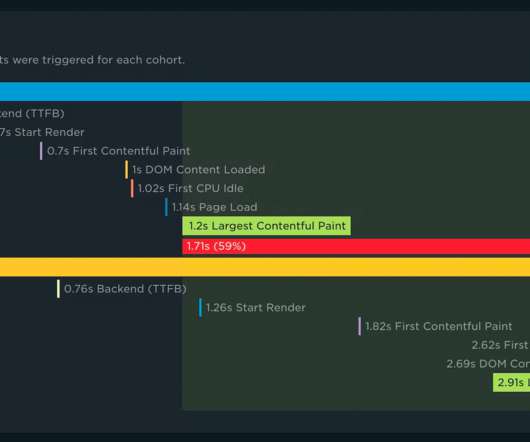
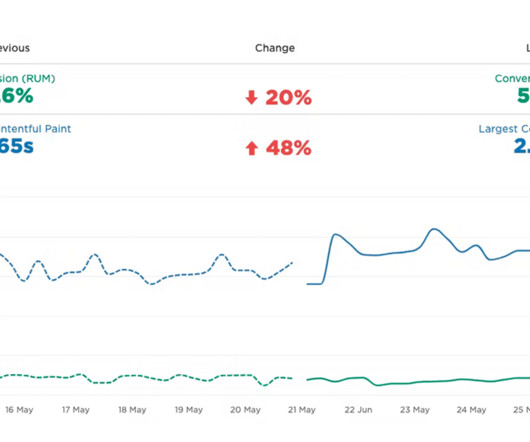
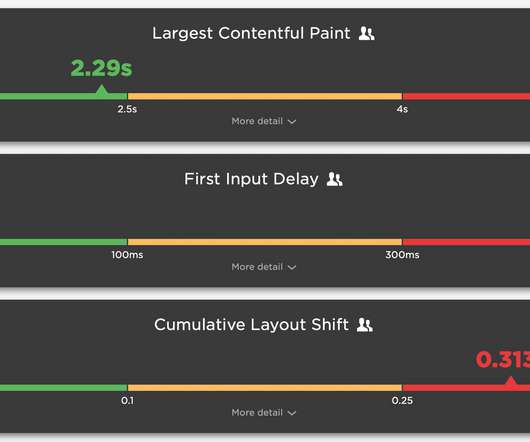
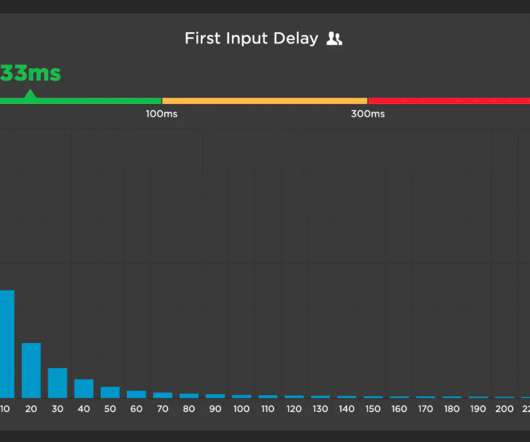
Exploratory data analytics is an analysis method that uses visualizations, including graphs and charts, to help IT teams investigate emerging data trends and circumvent issues, such as unexpected traffic spikes or performance degradations. Start by asking yourself what’s there, whether it’s logs, metrics, or traces.

Analytics 210
article thumbnail

Core Web Vitals for Search Engine Optimisation: What Do We Need to Know?

CSS Wizardry

Google do strongly encourage you to focus on site speed for better performance in Search, but, if you don’t pass all relevant Core Web Vitals (and the applicable factors from the Page Experience report) they will not push you down the rankings. All Core Web Vitals data used to rank you is taken from actual Chrome-based traffic to your site.

Insiders

Sign Up for our Newsletter

This site is protected by reCAPTCHA and the Google Privacy Policy and Terms of Service apply.

Trending Sources

article thumbnail

Service level objectives: 5 SLOs to get started

Dynatrace

Certain SLOs can help organizations get started on measuring and delivering metrics that matter. As organizations digitally transform, they’re also accelerating the speed of software delivery. The traffic SLO targets the website’s ability to handle a high volume of transactional activity during periods of high demand.

Latency 177
article thumbnail

Service level objective examples: 5 SLO examples for faster, more reliable apps

Dynatrace

Certain service-level objective examples can help organizations get started on measuring and delivering metrics that matter. Measuring application performance is increasingly important because as organizations digitally transform, they’re also accelerating the speed of software delivery. for the workout video playback feature.

Traffic 173
article thumbnail

Automated Change Impact Analysis with Site Reliability Guardian

Dynatrace

SREs face ever more challenging situations as environment complexity increases, applications scale up, and organizations grow: Growing dependency graphs result in blind spots and the inability to correlate performance metrics with user experience. Additionally, you can easily use any previously defined metrics and SLOs from your environments.

DevOps 219
article thumbnail

Gain fresh insights with key performance metrics for synthetic browser monitors

Dynatrace

However, understanding the performance of different application types requires an emphasis on different performance metrics, that is, key performance metrics. For many traditional web applications , User action duration is considered the best metric available for web-performance optimization.

Metrics 102
article thumbnail

How To Monitor And Optimize Google Core Web Vitals

Smashing Magazine

There are three web vitals metrics Google uses to measure different aspects of website performance: Largest Contentful Paint (LCP), Cumulative Layout Shift (CLS), Interaction to Next Paint (INP). Large preview ) Largest Contentful Paint (LCP) The Largest Contentful Paint metric is the closest thing to a traditional load time measurement.

Google 105