Remove Design Remove Latency Remove Network Remove Traffic
article thumbnail

Consistent caching mechanism in Titus Gateway

The Netflix TechBlog

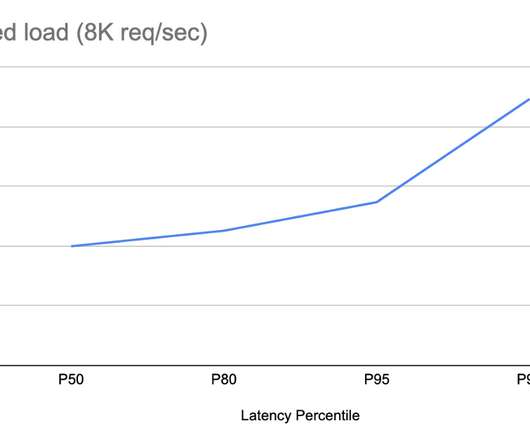
In that scenario, the system would need to deal with the data propagation latency directly, for example, by use of timeouts or client-originated update tracking mechanisms. With traffic growth, a single leader node handling all request volume started becoming overloaded. The cache is kept in sync with the current leader process.

Cache 224
article thumbnail

Dynatrace Managed turnkey Premium High Availability for globally distributed data centers (Early Adopter)

Dynatrace

The network latency between cluster nodes should be around 10 ms or less. Minimized cross-data center network traffic. For Premium HA, this has been extended from 10 ms latency (in the same network region) to around 100 ms network latency due to asynchronous data replication between regions.

Insiders

Sign Up for our Newsletter

This site is protected by reCAPTCHA and the Google Privacy Policy and Terms of Service apply.

Trending Sources

article thumbnail

Crucial Redis Monitoring Metrics You Must Watch

Scalegrid

Key Takeaways Critical performance indicators such as latency, CPU usage, memory utilization, hit rate, and number of connected clients/slaves/evictions must be monitored to maintain Redis’s high throughput and low latency capabilities. Similarly, an increased throughput signifies an intensive workload on a server and a larger latency.

Metrics 130
article thumbnail

Rapid Event Notification System at Netflix

The Netflix TechBlog

We thus assigned a priority to each use case and sharded event traffic by routing to priority-specific queues and the corresponding event processing clusters. This separation allows us to tune system configuration and scaling policies independently for different event priorities and traffic patterns.

Systems 334
article thumbnail

Rebuilding Netflix Video Processing Pipeline with Microservices

The Netflix TechBlog

This architecture shift greatly reduced the processing latency and increased system resiliency. We expanded pipeline support to serve our studio/content-development use cases, which had different latency and resiliency requirements as compared to the traditional streaming use case. divide the input video into small chunks 2.

article thumbnail

Seamlessly Swapping the API backend of the Netflix Android app

The Netflix TechBlog

For each route we migrated, we wanted to make sure we were not introducing any regressions: either in the form of missing (or worse, wrong) data, or by increasing the latency of each endpoint. Being able to canary a new route let us verify latency and error rates were within acceptable limits. Replay Testing Enter replay testing.

Latency 233
article thumbnail

Compression Methods in MongoDB: Snappy vs. Zstd

Percona

In this blog, we will discuss both data and network-level compression offered in MongoDB. We will discuss snappy and zstd for data block and zstd compression in a network. By default, MongoDB provides a snappy block compression method for storage and network communication. I am using PSMDB 6.0.4

Storage 108