Remove Availability Remove Event Remove Metrics Remove Performance
article thumbnail

Efficient SLO event integration powers successful AIOps

Dynatrace

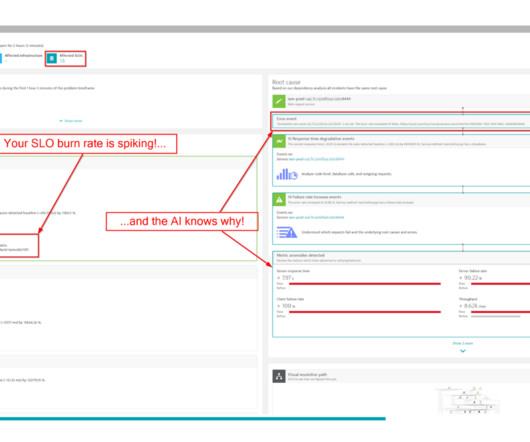
The first part of this blog post briefly explores the integration of SLO events with AI. For a more proactive approach and to gain further visibility, other SLOs focusing on performance can be implemented. The query arises: If within my detection perimeter, can the AI discern where the event occurred?

article thumbnail

Extend business observability: Extract business events from online databases (Part 2)

Dynatrace

In part 2, we’ll show you how to retrieve business data from a database, analyze that data using dashboards and ad hoc queries, and then use a Davis analyzer to predict metric behavior and detect behavioral anomalies. Dynatrace users typically use extensions to pull technical monitoring data, such as device metrics, into Dynatrace.

Database 269
Insiders

Sign Up for our Newsletter

This site is protected by reCAPTCHA and the Google Privacy Policy and Terms of Service apply.

Trending Sources

article thumbnail

Dynatrace simplifies OpenTelemetry metric collection for context-aware AI analytics

Dynatrace

The release candidate of OpenTelemetry metrics was announced earlier this year at Kubecon in Valencia, Spain. Since then, organizations have embraced OTLP as an all-in-one protocol for observability signals, including metrics, traces, and logs, which will also gain Dynatrace support in early 2023.

Analytics 280
article thumbnail

The value of business events: How IT can increase business agility

Dynatrace

Business events are a special class of events, new to Business Analytics; together with Grail, our data lakehouse, they provide the precision and advanced analytics capabilities required by your most important business use cases. What are business events? This diagram shows a few examples of business events.

Analytics 227
article thumbnail

New web performance insights with additional metrics and enhanced Visually complete for synthetic monitors

Dynatrace

Dynatrace Synthetic Monitoring allows you to proactively monitor the availability of your public as well as your internal web applications and API endpoints from locations around the globe or important internal locations such as branch offices. Synthetic monitors are also the perfect tool to monitor performance baselines.

Metrics 215
article thumbnail

Observability engineering: Getting Prometheus metrics right for Kubernetes with Dynatrace and Kepler

Dynatrace

To get a more granular look into telemetry data, many analysts rely on custom metrics using Prometheus. Named after the Greek god who brought fire down from Mount Olympus, Prometheus metrics have been transforming observability since the project’s inception in 2012.

Metrics 178
article thumbnail

In Defence of DOM­Content­Loaded

CSS Wizardry

I never thought I’d write an article in defence of DOMContentLoaded , but here it is… For many, many years now, performance engineers have been making a concerted effort to move away from technical metrics such as Load , and toward more user-facing, UX metrics such as Speed Index or Largest Contentful Paint. Or are they…?

Metrics 326