Remove Availability Remove Event Remove Java Remove Monitoring
article thumbnail

Managing High Availability in PostgreSQL – Part III: Patroni

Scalegrid

In the final post of this series, we will review the last solution, Patroni by Zalando, and compare all three at the end so you can determine which high availability framework is best for your PostgreSQL hosting deployment. Managing High Availability in PostgreSQL – Part I: PostgreSQL Automatic Failover. Patroni for PostgreSQL.

article thumbnail

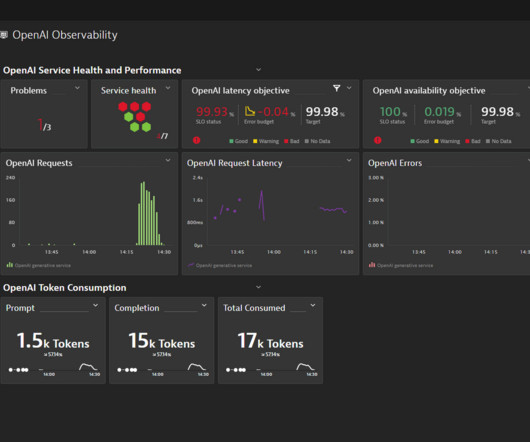
Dynatrace automatically monitors OpenAI ChatGPT for companies that deliver reliable, cost-effective services powered by generative AI

Dynatrace

It shows critical SLOs for latency and availability, as well as the most important OpenAI generative AI service metrics, such as response time, error count, and the overall number of requests. OneAgent can automatically monitor all C#,NET, Java, Go, and NodeJS bindings.

Insiders

Sign Up for our Newsletter

This site is protected by reCAPTCHA and the Google Privacy Policy and Terms of Service apply.

Trending Sources

article thumbnail

Managing High Availability in PostgreSQL – Part II

Scalegrid

Are you deploying PostgreSQL in the cloud and want to understand your options for achieving high availability? In our previous blog post, Managing High Availability in PostgreSQL – Part I , we discussed the capabilities and functioning of PostgreSQL Automatic Failover (PAF) by ClusterLabs. repmgr also supports event notifications.

article thumbnail

Understand and replay Android app crashes with Session Replay

Dynatrace

Instrumentation enables the shipment of a monitoring library with your app that collects telemetry data and sends it back to the Dynatrace platform for analysis. If you want an improved playback experience, we recommend that you capture custom events through the Session Replay API. Configure Session Replay for Android apps.

article thumbnail

Dynatrace and Google unleash cloud-native observability for GKE Autopilot

Dynatrace

Create a Kubernetes secret with a Dynatrace token kubectl -n dynatrace create secret generic dynakube --from-literal="apiToken=xxyyzz" Apply a Dynakube with Application monitoring and a CSI Driver This simple example helps. In this case, Davis found that a Java Spring Micrometer metric Failed Deliveries is highly correlated with CPU spikes.

Google 218
article thumbnail

Data Reprocessing Pipeline in Asset Management Platform @Netflix

The Netflix TechBlog

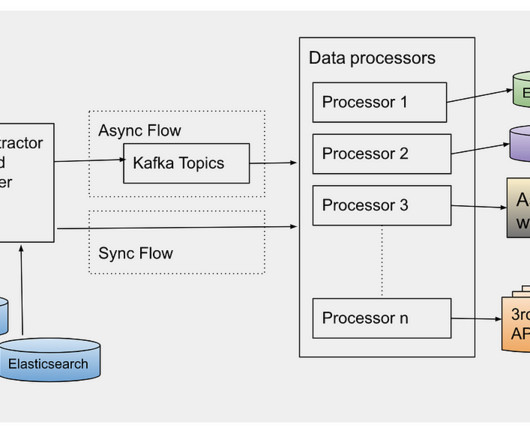
After reading the asset ids using one of the ways, an event is created per asset id to be processed synchronously or asynchronously based on the use case. For asynchronous processing, events are sent to Apache Kafka topics to be processed. Asynchronous Flow : Data processor consumes the data events sent by the data extractor.

Media 237
article thumbnail

Application observability meets developer observability: Unlock a 360º view of your environment

Dynatrace

With traditional monitoring tools, the granular data that developers require typically involves manual preparation. In this example, Grabner saw that the adservice workload was running on EKS and could see the relevant metrics, logs, services, events, error logs, and more. But developers need code-level visibility and code-level data.”