Remove Analytics Remove Definition Remove Infrastructure Remove Technology
article thumbnail

New analytics capabilities for messaging system-related anomalies

Dynatrace

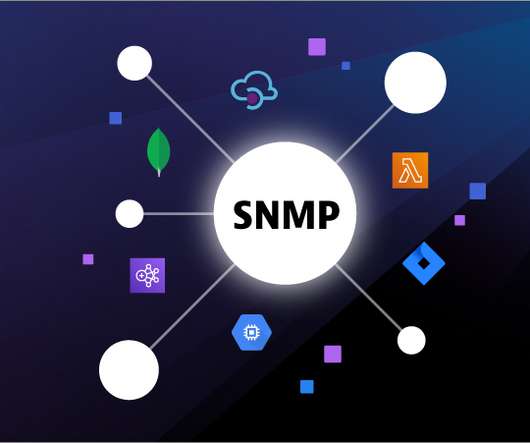
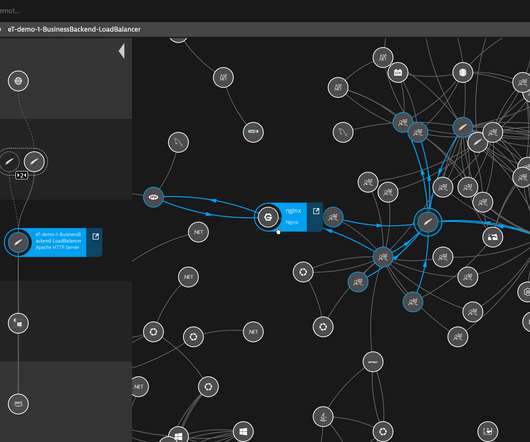
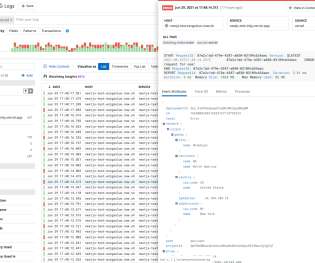
We’ve introduced brand-new analytics capabilities by building on top of existing features for messaging systems. Now, with technology-specific views, DevOps teams can see messaging system-related anomalies, which significantly simplifies troubleshooting efforts. Easily troubleshoot anomalies with technology-specific views.

Analytics 192
article thumbnail

New Prometheus-based extensions enable intelligent observability for more than 200 additional technologies

Dynatrace

Building on its advanced analytics capabilities for Prometheus data , Dynatrace now enables you to create extensions based on Prometheus metrics. This allows teams to extend the intelligent observability Dynatrace provides to all technologies that provide Prometheus exporters. Topology definition and entity extraction rules.

Insiders

Sign Up for our Newsletter

This site is protected by reCAPTCHA and the Google Privacy Policy and Terms of Service apply.

Trending Sources

article thumbnail

What is a data lakehouse? Combining data lakes and warehouses for the best of both worlds

Dynatrace

This data lands in its original, raw form without requiring schema definition. Generally, the storage technology categorizes data into landing, raw, and curated zones depending on its consumption readiness. Generally, the storage technology categorizes data into landing, raw, and curated zones depending on its consumption readiness.

article thumbnail

The history of Grail: Why you need a data lakehouse

Dynatrace

These technologies are poorly suited to address the needs of modern enterprises—getting real value from data beyond isolated metrics. Grail needs to support security data as well as business analytics data and use cases. High-performance analytics—no indexing required. So, there was a need to do something revolutionary.

article thumbnail

New SNMP platform extensions provide observability at scale for network devices

Dynatrace

The success of an organization often depends on the quality of the on-premises or physical IT infrastructure, among other things. Constantly monitoring infrastructure health state and making ongoing optimizations are essential for Ops teams, SREs (site-reliability engineers), and IT admins. Dynatrace news. ” What’s next.

Network 216
article thumbnail

Dynatrace observability is now available for Red Hat OpenShift on the IBM® Power® architecture

Dynatrace

Red Hat OpenShift monitoring with Dynatrace stands out due to the following key aspects: Infrastructure health monitoring and optimization: Assess the status of your infrastructure at a glance, understand resource consumption, optimize resource allocation for cost-efficiency, and track software versions running within the Kubernetes environment.

article thumbnail

Flexible, scalable, self-service Kubernetes native observability now in General Availability

Dynatrace

To solve this problem , Dynatrace offers a fully automated approach to infrastructure and application observability including Kubernetes control plane, deployments, pods, nodes, and a wide array of cloud-native technologies. None of this complexity is exposed to application and infrastructure teams.