Remove Analysis Remove Code Remove Java Remove Tuning
article thumbnail

Unlock end-to-end observability insights with Dynatrace PurePath 4 seamless integration of OpenTracing for Java

Dynatrace

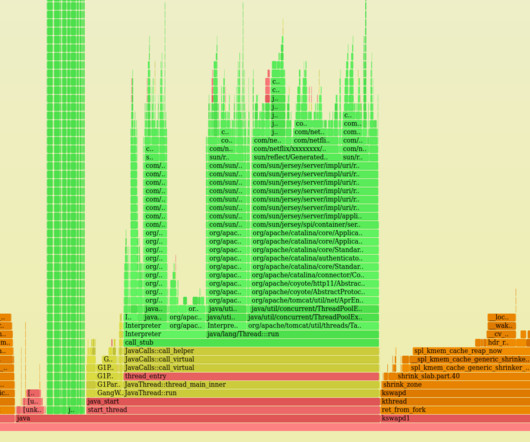
Cloud-native technologies and microservice architectures have shifted technical complexity from the source code of services to the interconnections between services. Deep-code execution details. You get code-level insights into application code without code changes. Dynatrace news. The app is powered by Kubernetes.

Java 239
article thumbnail

Optimize your applications with 24×7 continuous thread analysis

Dynatrace

Thread dumps allow Java developers to understand which threads execute which code and whether or not certain threads are waiting or locked. Thread dumps are now a thing of the past; the future belongs to 24×7 continuous thread analysis. Identify and solve performance bottlenecks faster with continuous thread analysis.

Java 103
Insiders

Sign Up for our Newsletter

This site is protected by reCAPTCHA and the Google Privacy Policy and Terms of Service apply.

Trending Sources

article thumbnail

How to fine tune failure detection

Dynatrace

Automatic failure detection works well in most cases especially for web services and when developers follow good coding practices. It is basically an exception which the code doesn’t expect to occur and therefore doesn’t deal with. For instance, if I expect a “dataValidationException”, the code would look like this: Try. {.

Tuning 115
article thumbnail

Understand and replay Android app crashes with Session Replay

Dynatrace

Instrumentation enables the shipment of a monitoring library with your app that collects telemetry data and sends it back to the Dynatrace platform for analysis. This includes selecting the app to be instrumented, fine-tuning cost controls, and enabling users to opt-in to Session Replay recording. Mask sensitive data. Get started.

article thumbnail

Terminology matters: how to enhance user experience by aligning names with expectations

Dynatrace

In talking to customers internally and externally, we recognized that some of our analysis views, like the CPU analysis , are in fact ultimately what our users need, however they remain overlooked capabilities of our platform. NET or Java footprint (as diagnostic tools are especially useful for these). Sounds great right?

Java 246
article thumbnail

Dynatrace Application Security detects and blocks attacks automatically in real-time

Dynatrace

They are part of continuous delivery pipelines and examine code to find vulnerabilities. There is another critical element that needs to be addressed: how do you protect applications against attacks exploiting vulnerabilities while DevSecOps teams simultaneously try to resolve those issues in the code ? How to get started.

Traffic 237
article thumbnail

PostgreSQL vs. Oracle: Difference in Costs, Ease of Use & Functionality

Scalegrid

Compare ease of use across compatibility, extensions, tuning, operating systems, languages and support providers. Oracle requires more complex ongoing administration, as all database configurations must evolve in conjunction with the data schemas and custom code. Compare Ease of Use. SolarisUnix. Supported Languages. JavaScript.