Remove tag visual-modeling
article thumbnail

Dynatrace extends contextual analytics and AIOps for open observability

Dynatrace

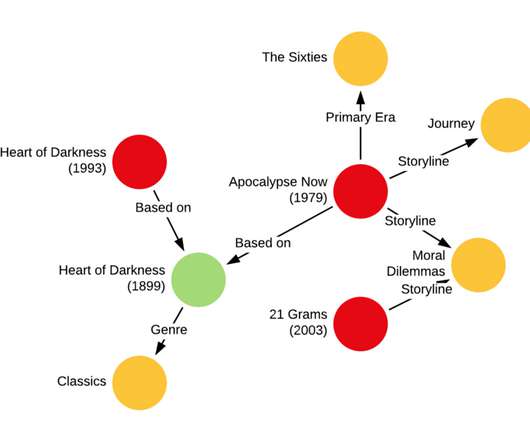
Relying solely on traditional analysis methods like tagging and data correlation to answer such questions is inadequate when an IT landscape isn’t properly represented in a data model or when the cause-and-effect chain of services remains unclear.
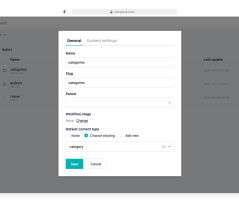
Analytics 246
article thumbnail

Dynatrace Support for AWS Lambda Functions Powered by x86 and AWS Graviton2

Dynatrace

In addition, Dynatrace visualizes each Lambda function interactive map of how everything is interconnected using our patented Smartscape technology. Choose from any of five visualizations: graph, pie, single value, table, or top list. Add your visualization right to your dashboards for easy access and sharing.

Lambda 210
Insiders

Sign Up for our Newsletter

This site is protected by reCAPTCHA and the Google Privacy Policy and Terms of Service apply.

Trending Sources

article thumbnail

Detecting Speech and Music in Audio Content

The Netflix TechBlog

Iroro Orife , Chih-Wei Wu and Yun-Ning (Amy) Hung Introduction When you enjoy the latest season of Stranger Things or Casa de Papel (Money Heist) , have you ever wondered about the secrets to fantastic story-telling, besides the stunning visual presentation? surround format at 48 kHz sampling rate.

article thumbnail

Open-Sourcing a Monitoring GUI for Metaflow

The Netflix TechBlog

The GUI can be extended with plugins, allowing the community to build integrations to other systems, custom visualizations, and embed upcoming features of Metaflow directly into its views. We also had no need to build a model-monitoring GUI yet, which is a wholly separate problem domain. all using their favorite IDEs and terminals.

article thumbnail

Upgrade to the Data explorer to level up your data visualizations and analysis

Dynatrace

And so, getting simple visualization use cases done efficiently becomes far from the norm. When looking at the market, we see the following shortcomings of solutions: They’re either good at automated analytics , using AI engines, or at providing visualization/ dashboarding capabilities, but not both.

Metrics 225
article thumbnail

Dynatrace supports the newly released AWS Lambda Response Streaming

Dynatrace

In traditional request-response models, the response needs to be fully generated and buffered before it is returned to the client. Additionally, Dynatrace auto-discovers an environment and visualizes all its dependencies, so it can determine precisely how problems evolve and how they affect the user experience.

Lambda 212
article thumbnail

Using JSONB in PostgreSQL: How to Effectively Store & Index JSON Data in PostgreSQL

Scalegrid

If you store each of the keys as columns, it will result in frequent DML operations – this can be difficult when your data set is large - for example, event tracking, analytics, tags, etc. It will result in a sequential scan: demo=# select * from books where data->'tags' ?

Storage 321