article thumbnail

Easily monitor IBM i with updated Dynatrace extension

Dynatrace

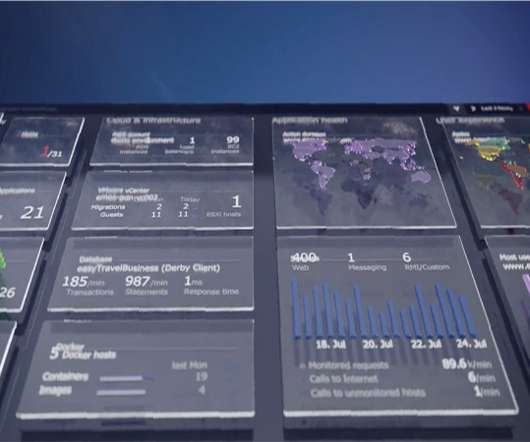
It’s all monitored remotely ! Default dashboard for IBM I monitoring The default dashboard provides an overview of all monitored systems and how many different entities are created by IBM i components. It’s crucial to monitor the performance of these jobs, including their CPU usage, number of instances, and status.

article thumbnail

Testing Your Monitoring Configurations

DZone

Monitoring is a small aspect of our operational needs; configuring, monitoring, and checking the configuration of tools such as Fluentd and Fluentbit can be a bit frustrating, particularly if we want to validate more advanced configuration that does more than simply lift log files and dump the content into a solution such as OpenSearch.

Insiders

Sign Up for our Newsletter

This site is protected by reCAPTCHA and the Google Privacy Policy and Terms of Service apply.

Trending Sources

article thumbnail

Container monitoring for VA Platform One helps VA achieve workload performance

Dynatrace

Dynatrace container monitoring supports customers as they collect metrics, traces, logs, and other observability-enabled data to improve the health and performance of containerized applications. The post Container monitoring for VA Platform One helps VA achieve workload performance appeared first on Dynatrace news.

article thumbnail

Automating DevOps practices fuels speed and quality

Dynatrace

Still, while DevOps practices enable developer agility and speed as well as better code quality, they can also introduce complexity and data silos. Software development is often at the center of this speed-quality tradeoff. Automating DevOps practices boosts development speed and code quality.

DevOps 274
article thumbnail

The psychology of site speed and human happiness

Speed Curve

In the fourteen years that I've been working in the web performance industry, I've done a LOT of research, writing, and speaking about the psychology of page speed – in other words, why we crave fast, seamless online experiences. In fairness, that was in the early 2000s, and site speed was barely on anyone's radar.

Speed 135
article thumbnail

What are quality gates? How to use quality gates to deliver better software at speed and scale

Dynatrace

By actively monitoring metrics such as error rate, success rate, and CPU load, quality gates instill confidence in teams during software releases. In the context of Easytravel, one can measure the speed at which a specific page of the application responds after a user clicks on it. Fewer expensive fixes.

Speed 215
article thumbnail

Crucial Redis Monitoring Metrics You Must Watch

Scalegrid

You will need to know which monitoring metrics for Redis to watch and a tool to monitor these critical server metrics to ensure its health. This blog post lists the important database metrics to monitor. Effective monitoring of key performance indicators plays a crucial role in maintaining this optimal speed of operation.

Metrics 130