article thumbnail

Extract metrics from business events to increase the value of business analytics

Dynatrace

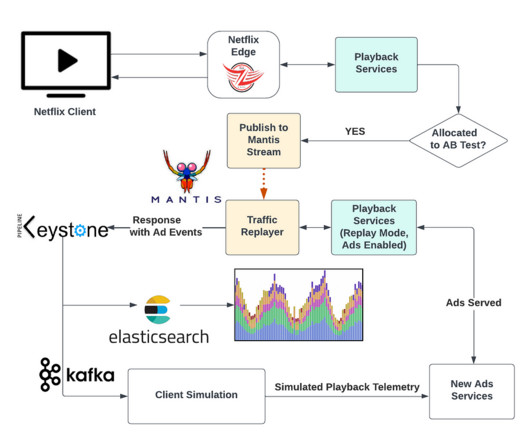
Technology and business leaders express increasing interest in integrating business data into their IT observability strategies, citing the value of effective collaboration between business and IT. To close these critical gaps, Dynatrace has defined a new class of events called business events.

Analytics 202
article thumbnail

Efficient SLO event integration powers successful AIOps

Dynatrace

The first part of this blog post briefly explores the integration of SLO events with AI. Consequently, the AI is founded upon the related events, and due to the detection parameters (threshold, period, analysis interval, frequent detection, etc), an issue arose. See the following example with BurnRate formula for Failure rate event.

Insiders

Sign Up for our Newsletter

This site is protected by reCAPTCHA and the Google Privacy Policy and Terms of Service apply.

Trending Sources

article thumbnail

What is application modernization? How to pick an application modernization strategy

Dynatrace

Today, organizations must adopt solid modernization strategies to stay competitive in the market. According to a recent IDC report , IT organizations need to create a modernization and rationalization plan that aligns with their overall digital transformation strategy. Crafting an application modernization strategy.

Strategy 227
article thumbnail

Intelligent, context-aware AI analytics for all your custom metrics

Dynatrace

Dynatrace recently opened up the enterprise-grade functionalities of Dynatrace OneAgent to all the data needed for observability, including metrics, events, logs, traces, and topology data. Davis topology-aware anomaly detection and alerting for your custom metrics. Topology and non-topology metrics—what’s the difference?

Metrics 245
article thumbnail

Observability engineering: Getting Prometheus metrics right for Kubernetes with Dynatrace and Kepler

Dynatrace

To get a more granular look into telemetry data, many analysts rely on custom metrics using Prometheus. Named after the Greek god who brought fire down from Mount Olympus, Prometheus metrics have been transforming observability since the project’s inception in 2012.

Metrics 178
article thumbnail

Dynatrace innovates again with the release of topology-driven auto-adaptive metric baselines

Dynatrace

With the advent and ingestion of thousands of custom metrics into Dynatrace, we’ve once again pushed the boundaries of automatic, AI-based root cause analysis with the introduction of auto-adaptive baselines as a foundational concept for Dynatrace topology-driven timeseries measurements. In many cases, metric behavior changes over time.

Metrics 211
article thumbnail

Effective Log Data Analysis With Amazon CloudWatch: Harnessing Machine Learning

DZone

Logs can include a wide variety of data, including system events, transaction data, user activities, web browser logs, errors, and performance metrics. In today's cloud computing world, all types of logging data are extremely valuable.

Analytics 279