Remove Benchmarking Remove Metrics Remove Open Source Remove Processing
article thumbnail

Why applying chaos engineering to data-intensive applications matters

Dynatrace

Stream processing One approach to such a challenging scenario is stream processing, a computing paradigm and software architectural style for data-intensive software systems that emerged to cope with requirements for near real-time processing of massive amounts of data.

article thumbnail

Container security: What it is, why it’s tricky, and how to do it right

Dynatrace

Container security is the practice of applying security tools, processes, and policies to protect container-based workloads. Application developers commonly leverage open-source software when building containerized applications. 1] And unfortunately, open-source software is often fraught with security vulnerabilities.

Insiders

Sign Up for our Newsletter

This site is protected by reCAPTCHA and the Google Privacy Policy and Terms of Service apply.

Trending Sources

article thumbnail

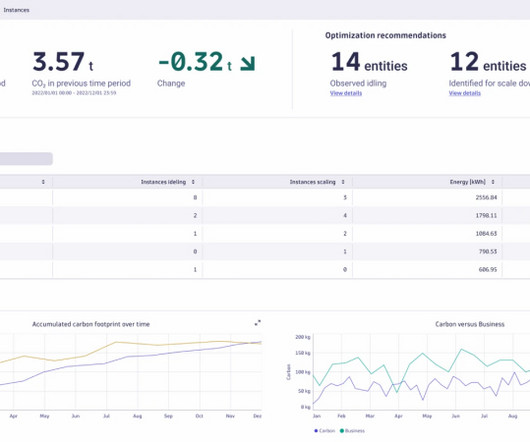
IT carbon footprint: Dynatrace Carbon Impact and Optimization app helps organizations measure cloud computing carbon footprint

Dynatrace

Developed using guidance from the Sustainable Digital Infrastructure Alliance (SDIA) and expanding on formulas from the open source project Cloud Carbon Footprint , Carbon Impact measures and reports the IT carbon footprint of all Dynatrace-monitored hosts across an organization’s entire hybrid and multicloud environment in a single interface.

Energy 222
article thumbnail

10 tips for migrating from monolith to microservices

Dynatrace

It is better to consider refactoring as part of the application transformation process before migrating, if possible. End-to-end observability starts with tracking logs, metrics, and traces of all the components, providing a better understanding of service relationships and application dependencies.

article thumbnail

Grafana Dashboards: A PoC Implementing the PostgreSQL Extension pg_stat_monitor

Percona

This PoC demonstrates how to install and configure pg_stat_monitor in order to extract useful and actionable metrics from a PostgreSQL database and display them on a Grafana dashboard. This simplifies debugging and analysis processes by enabling users to execute the same query. About the environment Grafana: version 10.0.0

article thumbnail

How To Scale a Single-Host PostgreSQL Database With Citus

Percona

About the cluster Following a step-by-step process, the objective is to create a four-node cluster consisting of: PostgreSQL version 15 Citus extension (I’ll be using version 11, but there are newer ones available.) In order to speed up the benchmark indexes must be added. psql pgbench <<_eof1_ qecho adding node citus3.

Database 102
article thumbnail

HammerDB for Managers

HammerDB

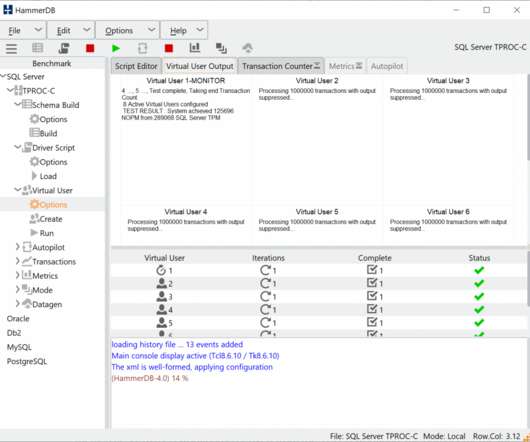
HammerDB is a software application for database benchmarking. Databases are highly sophisticated software, and to design and run a fair benchmark workload is a complex undertaking. The Transaction Processing Performance Council (TPC) was founded to bring standards to database benchmarking, and the history of the TPC can be found here.