article thumbnail

Why applying chaos engineering to data-intensive applications matters

Dynatrace

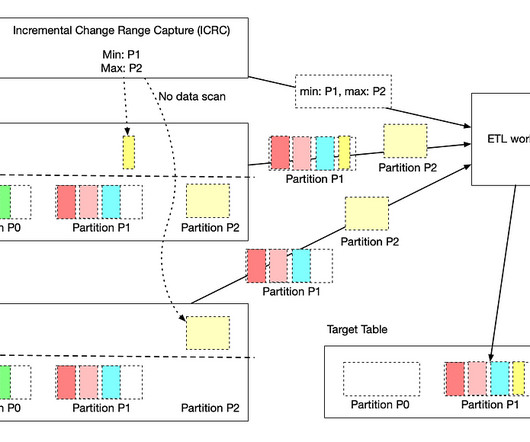
Stream processing systems, designed for continuous, low-latency processing, demand swift recovery mechanisms to tolerate and mitigate failures effectively. This significantly increases event latency. The latency recovery is depicted below, where Flink again achieved the fastest recovery. Recovery time of the latency p90.

article thumbnail

Dynatrace supports SnapStart for Lambda as an AWS launch partner

Dynatrace

The new Amazon capability enables customers to improve the startup latency of their functions from several seconds to as low as sub-second (up to 10 times faster) at P99 (the 99th latency percentile). This can cause latency outliers and may lead to a poor end-user experience for latency-sensitive applications.

Lambda 225
Insiders

Sign Up for our Newsletter

This site is protected by reCAPTCHA and the Google Privacy Policy and Terms of Service apply.

Trending Sources

article thumbnail

Managing risk for financial services: The secret to visibility and control during times of volatility

Dynatrace

In summary, the Dynatrace platform enables banks to do the following: Capture any data type: logs, metrics, traces, topology, behavior, code, metadata, network, security, web, and real-user monitoring data, and business events. Maximize performance for high-frequency and low-latency trading strategies. Automated issue resolution.

Analytics 201
article thumbnail

Dynatrace supports the newly released AWS Lambda Response Streaming

Dynatrace

Customers can use AWS Lambda Response Streaming to improve performance for latency-sensitive applications and return larger payload sizes. Triggering the Lambda function is event-driven and could include changes in state or an update to a file. To learn more about the AWS Lambda features, visit the Lamba features page.

Lambda 216
article thumbnail

Implementing service-level objectives to improve software quality

Dynatrace

Dynatrace provides a centralized approach for establishing, instrumenting, and implementing SLOs that uses full-stack observability , topology mapping, and AI-driven analytics. Latency is the time that it takes a request to be served. Use SLO data to communicate with stakeholders and drive better business decisions. Reliability.

Software 263
article thumbnail

Optimize your environment: Unveiling Dynatrace Hyper-V extension for enhanced performance and efficient troubleshooting

Dynatrace

As such, the observability platform used to monitor Hyper-V should ideally fulfill requirements for holistic visibility, correlation and causation analysis, AI-powered analytics, scalability, and security. Dynatrace is a platform that satisfies all these criteria. Learn more about the pillars of modern observability in this e-book.

article thumbnail

Data Reprocessing Pipeline in Asset Management Platform @Netflix

The Netflix TechBlog

Production Use Cases Real-Time APIs (backed by the Cassandra database) for asset metadata access don’t fit analytics use cases by data science or machine learning teams. After reading the asset ids using one of the ways, an event is created per asset id to be processed synchronously or asynchronously based on the use case.

Media 237