Remove Analysis Remove Hardware Remove Monitoring Remove Network
article thumbnail

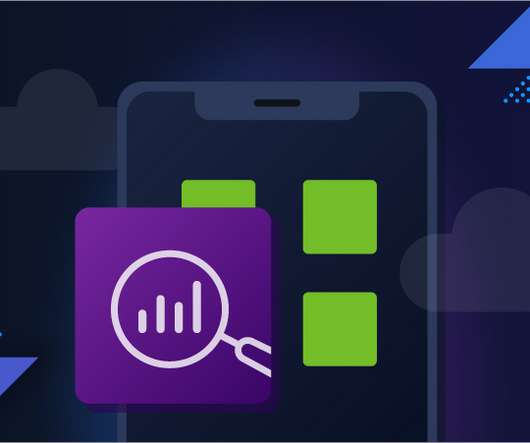
Faster crash analysis for mobile apps

Dynatrace

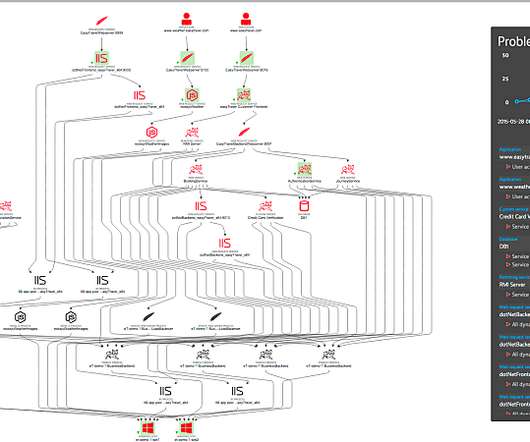
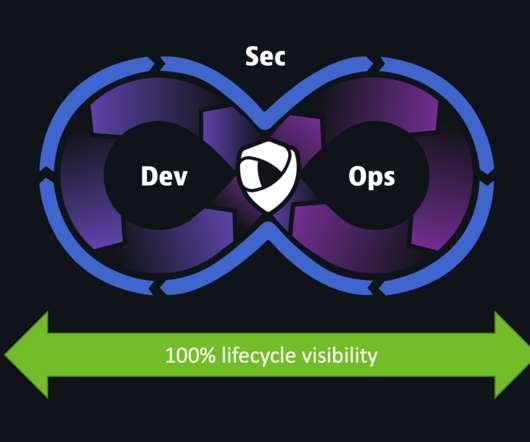
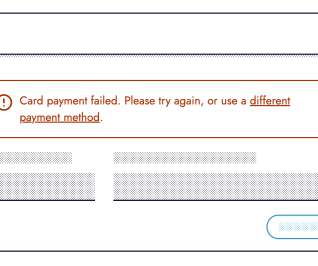
To be ready to deal with crashes, you need a monitoring solution that alerts you to critical events, provides you with an overview of crash events, and enables you to quickly resolve issues that contribute to crashes. Instantaneous crash analysis. That’s why we also improved the information density of the crash analysis pages.

Mobile 245
article thumbnail

Optimize your environment: Unveiling Dynatrace Hyper-V extension for enhanced performance and efficient troubleshooting

Dynatrace

It enables multiple operating systems to run simultaneously on the same physical hardware and integrates closely with Windows-hosted services. Firstly, managing virtual networks can be complex as networking in a virtual environment differs significantly from traditional networking.

Insiders

Sign Up for our Newsletter

This site is protected by reCAPTCHA and the Google Privacy Policy and Terms of Service apply.

Trending Sources

article thumbnail

Redis® Monitoring Strategies for 2024

Scalegrid

In today’s data-driven world, the ability to effectively monitor and manage data is of paramount importance. With its widespread use in modern application architectures, understanding the ins and outs of Redis® monitoring is essential for any tech professional. Redis®, a powerful in-memory data store, is no exception.

Strategy 130
article thumbnail

SmartTV crash analysis with Dynatrace

Dynatrace

and, just like other software or hardware products, DNA runs internal testing groups where employees can beta test new devices and give feedback so that any annoying usability issues are addressed before hitting the mass market. Crashes sometimes happen because of a specific combination of hardware, software and the environment (e.g.,

Mobile 191
article thumbnail

Why log monitoring and log analytics matter in a hyperscale world

Dynatrace

Log monitoring, log analysis, and log analytics are more important than ever as organizations adopt more cloud-native technologies, containers, and microservices-based architectures. A log is a detailed, timestamped record of an event generated by an operating system, computing environment, application, server, or network device.

Analytics 208
article thumbnail

Crucial Redis Monitoring Metrics You Must Watch

Scalegrid

You will need to know which monitoring metrics for Redis to watch and a tool to monitor these critical server metrics to ensure its health. These can help you ensure your system’s health and quickly perform root cause analysis of any performance-related issue you might be encountering.

Metrics 130
article thumbnail

What is ITOps? Why IT operations is more crucial than ever in a multicloud world

Dynatrace

Besides the traditional system hardware, storage, routers, and software, ITOps also includes virtual components of the network and cloud infrastructure. Computer operations manages the physical location of the servers — cooling, electricity, and backups — and monitors and responds to alerts. Why is IT operations important?