article thumbnail

Crucial Redis Monitoring Metrics You Must Watch

Scalegrid

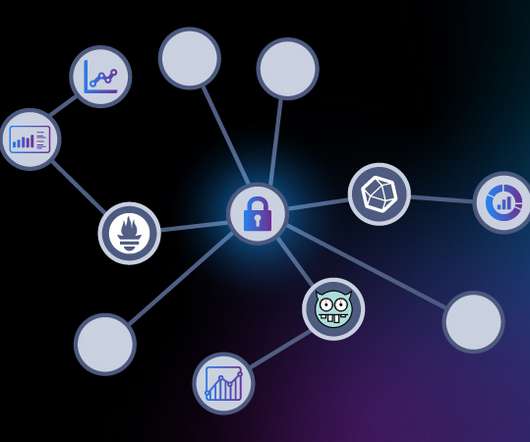
You will need to know which monitoring metrics for Redis to watch and a tool to monitor these critical server metrics to ensure its health. These can help you ensure your system’s health and quickly perform root cause analysis of any performance-related issue you might be encountering.

Metrics 130
article thumbnail

New web performance insights with additional metrics and enhanced Visually complete for synthetic monitors

Dynatrace

Dynatrace Synthetic Monitoring allows you to proactively monitor the availability of your public as well as your internal web applications and API endpoints from locations around the globe or important internal locations such as branch offices. Synthetic monitors help you find issues before they affect your customers.

Metrics 220
Insiders

Sign Up for our Newsletter

This site is protected by reCAPTCHA and the Google Privacy Policy and Terms of Service apply.

Trending Sources

article thumbnail

What is infrastructure monitoring and why is it mission-critical in the new normal?

Dynatrace

This shift requires infrastructure monitoring to ensure all your components work together across applications, operating systems, storage, servers, virtualization, and more. What is infrastructure monitoring? . What to look for when selecting an infrastructure monitoring solution?

article thumbnail

Implementing service-level objectives to improve software quality

Dynatrace

Instead, they can ensure that services comport with the pre-established benchmarks. In what follows, we explore some of these best practices and guidance for implementing service-level objectives in your monitored environment. Establish realistic SLO targets based on statistical and probabilistic analysis. Availability.

Software 269
article thumbnail

Measuring the importance of data quality to causal AI success

Dynatrace

It uses fault-tree analysis to identify the component events that cause outcomes at a higher level. Causal AI applies a deterministic approach to anomaly detection and root-cause analysis that yields precise, continuous, and actionable insights in real time. That’s where causal AI can help.

article thumbnail

Grafana Dashboards: A PoC Implementing the PostgreSQL Extension pg_stat_monitor

Percona

Configuring Grafana For our purposes, the Grafana datasource used in this PoC is also the Postgres data cluster that is generating the data to be monitored. pg_stat_monitor About pg_stat_monitor is a Query Performance Monitoring tool for PostgreSQL. A script executing a benchmarking run: #!/bin/bash

article thumbnail

IT carbon footprint: Dynatrace Carbon Impact and Optimization app helps organizations measure cloud computing carbon footprint

Dynatrace

Nonetheless, to help mitigate climate change, it’s critically important for organizations to measure, monitor, and reduce their IT carbon footprints. The Carbon Impact app assesses carbon emissions and energy consumption from all monitored hosts. Certainly, this is true for us.  That’s why we developed Carbon Impact.

Energy 239