article thumbnail

What are quality gates? How to use quality gates to deliver better software at speed and scale

Dynatrace

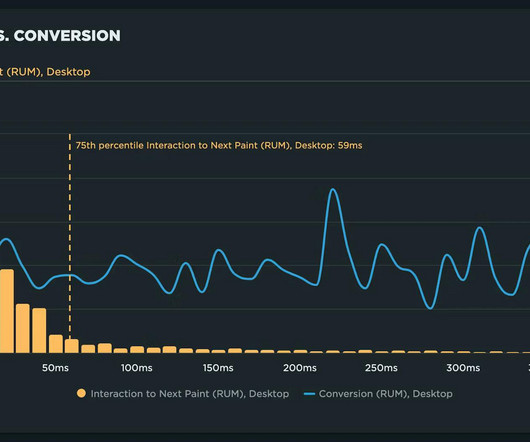
By actively monitoring metrics such as error rate, success rate, and CPU load, quality gates instill confidence in teams during software releases. These metrics are latency, traffic, errors, and saturation, all of which must be key considerations when curating user experience. Fewer expensive fixes. Start a 15-day free trial today.

Speed 196
article thumbnail

Crucial Redis Monitoring Metrics You Must Watch

Scalegrid

You will need to know which monitoring metrics for Redis to watch and a tool to monitor these critical server metrics to ensure its health. This blog post lists the important database metrics to monitor. Effective monitoring of key performance indicators plays a crucial role in maintaining this optimal speed of operation.

Metrics 130
Insiders

Sign Up for our Newsletter

This site is protected by reCAPTCHA and the Google Privacy Policy and Terms of Service apply.

Trending Sources

article thumbnail

Redis® Monitoring Strategies for 2024

Scalegrid

In today’s data-driven world, the ability to effectively monitor and manage data is of paramount importance. With its widespread use in modern application architectures, understanding the ins and outs of Redis® monitoring is essential for any tech professional. Redis®, a powerful in-memory data store, is no exception.

Strategy 130
article thumbnail

Latency vs. Throughput: Navigating the Digital Highway

VoltDB

In this fast-paced ecosystem, two vital elements determine the efficiency of this traffic: latency and throughput. LATENCY: THE WAITING GAME Latency is like the time you spend waiting in line at your local coffee shop. All these moments combined represent latency – the time it takes for your order to reach your hands.

Latency 52
article thumbnail

Running A Page Speed Test: Monitoring vs. Measuring

Smashing Magazine

Running A Page Speed Test: Monitoring vs. Measuring Running A Page Speed Test: Monitoring vs. Measuring Geoff Graham 2023-08-10T08:00:00+00:00 2023-08-10T12:35:05+00:00 This article is sponsored by DebugBear There is no shortage of ways to measure the speed of a webpage. Lighthouse results.

Speed 82
article thumbnail

Real user monitoring vs. synthetic monitoring: Understanding best practices

Dynatrace

As businesses compete for customer loyalty, it’s critical to understand the difference between real-user monitoring and synthetic user monitoring. However, not all user monitoring systems are created equal. What is real user monitoring? Real-time monitoring of user application and service interactions.

article thumbnail

What is real user monitoring (RUM)?

Dynatrace

Real user monitoring can help you catch these issues before they impact the bottom line. What is real user monitoring? Real user monitoring (RUM) is a performance monitoring process that collects detailed data about a user’s interaction with an application. Real user monitoring collects data on a variety of metrics.