article thumbnail

Unlock end-to-end observability insights with Dynatrace PurePath 4 seamless integration of OpenTracing for Java

Dynatrace

Dynatrace is fully committed to the OpenTelemetry community and to the seamless integration of OpenTelemetry data , including ingestion of custom metrics , into the Dynatrace open analytics platform. With Dynatrace OneAgent you also benefit from support for traffic routing and traffic control.

Java 235
article thumbnail

Optimizing Java XPath CPU and memory overhead by 98%

Dynatrace

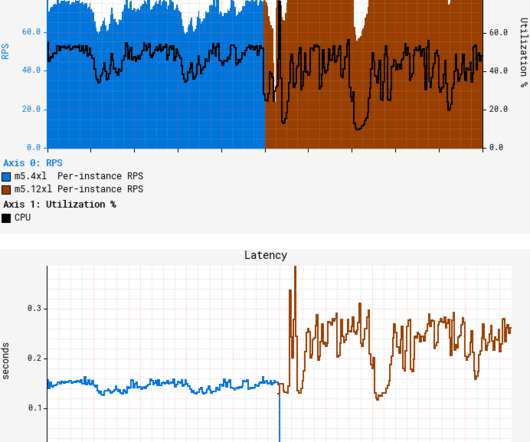
Therefore, it was unsurprising to see a huge spike in traffic for Family Visa enrollment via Metrash. Let’s start with the spike in load: The high demand on family visa enrollments resulted in a huge traffic and CPU spike. The metrics are great for anyone in operations and capacity planning.

Java 224
Insiders

Sign Up for our Newsletter

This site is protected by reCAPTCHA and the Google Privacy Policy and Terms of Service apply.

Trending Sources

article thumbnail

The road to observability with OpenTelemetry demo part 1: Identifying metrics and traces

Dynatrace

That is, relying on metrics, logs, and traces to understand what software is doing and where it’s running into snags. In addition to tracing, observability also defines two other key concepts, metrics and logs. When software runs in a monolithic stack on on-site servers, observability is manageable enough.

Metrics 182
article thumbnail

Log auditing and log forensics benefit from converging observability and security data

Dynatrace

As organizations adopt more cloud-native technologies, observability data—telemetry from applications and infrastructure, including logs, metrics, and traces—and security data are converging. for example, collate which and how many Java applications were attacked) Did we lose any critical data? Incomplete. Skills and expertise.

Analytics 187
article thumbnail

Data Reprocessing Pipeline in Asset Management Platform @Netflix

The Netflix TechBlog

Existing data got updated to be backward compatible without impacting the existing running production traffic. For fast processing of the events, we use different settings of Kafka consumer and Java executor thread pool. We collect the failure metrics to be checked and fixed later.

Media 237
article thumbnail

Kubernetes OOMKilled troubleshooting: Diagnosing out-of-memory issues automatically

Dynatrace

Each tenant gets its own e-commerce site deployed on a shared Kubernetes cluster, isolated through separate namespaces and additional traffic isolation. There was not much traffic during the weekend, but as Monday came along, Dynatrace started sending alerts about a high HTTP failure rate across almost every tenant on the backend service.

Java 192
article thumbnail

The road to observability demo part 3: Collect, instrument, and analyze telemetry data automatically with Dynatrace

Dynatrace

Making applications observable—relying on metrics, logs, and traces to understand what software is doing and how it’s performing—has become increasingly important as workloads are shifting to multicloud environments. We also introduced our demo app and explained how to define the metrics and traces it uses.

Metrics 173