article thumbnail

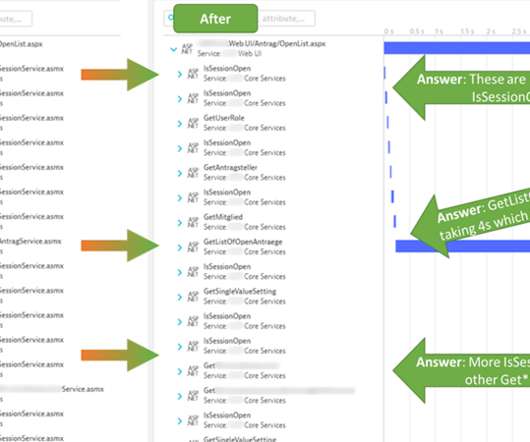
Monitor web applications from within your corporate network

Dynatrace

We’re happy to announce the launch of Dynatrace Synthetic private browser monitors! We continue to grow our public synthetic monitoring locations, but customers using Dynatrace Synthetic still need to monitor the performance and availability of internal web applications. How do I set up private browser monitoring?

Network 155
article thumbnail

A guide to ASP.NET web service observability, diagnostics and performance optimization with Dynatrace

Dynatrace

The challenge with ASP.NET Web Service Observability, Diagnostics and Performance Optimization is that most monitoring & diagnostic tools only provide global Service Level Indicators metrics (SLIs) such as response time, failure rate, and throughput, but not metrics for each individual service endpoint. Dynatrace news.

Insiders

Sign Up for our Newsletter

This site is protected by reCAPTCHA and the Google Privacy Policy and Terms of Service apply.

Trending Sources

article thumbnail

Getting Started with LoadView On-Demand Performance Testing

Dotcom-Montior

Today we’ll be reviewing LoadView , an on-demand load-testing platform from Dotcom-Monitor that makes realistic load testing possible without an up-front investment in hardware or software infrastructure. This review will focus on performing a simple load test with LoadView. Creating a Script. Conclusion.

article thumbnail

A guide to Autonomous Performance Optimization

Dynatrace

After every experiment run Akamas changes application, runtime, database or cloud configuration based on monitoring data it captured during the previous experiment run. Akamas integrates with many popular monitoring tools like Prometheus or Dynatrace and with load injection tools like Neoload or Loadrunner to gather performance data.

article thumbnail

How to boost SRE productivity with observability-driven DevOps

Dynatrace

But, manual steps — such as reviewing test results and addressing production issues resulting from performance, resiliency, security, or functional issues — often hinder these efforts. For instance, for a performance test window of 10 minutes, SLOs targets are evaluated and SLO health scores are visualized build-over-build.

DevOps 218
article thumbnail

Ten years of page bloat: What have we learned?

Speed Curve

Poorly executed stylesheets can create a host of performance problems, ranging from stylesheets taking too long to download and parse, to improperly placed stylesheets that block the rest of the page from rendering. We need to monitor our pages consistently over time. How does page bloat hurt your business? Fight regression.

Mobile 145
article thumbnail

Improving JavaScript Bundle Performance With Code-Splitting

Smashing Magazine

Projects built using JavaScript-based frameworks often ship large bundles of JavaScript that take time to download, parse and execute, blocking page render and user input in the process. Performance Costs. JavaScript’s effect on performance consists of download, parsing and the execution costs. Adrian Bece.

Code 90