article thumbnail

The road to observability with OpenTelemetry demo part 1: Identifying metrics and traces

Dynatrace

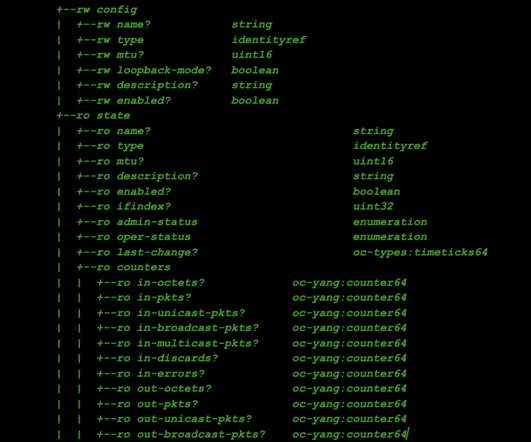
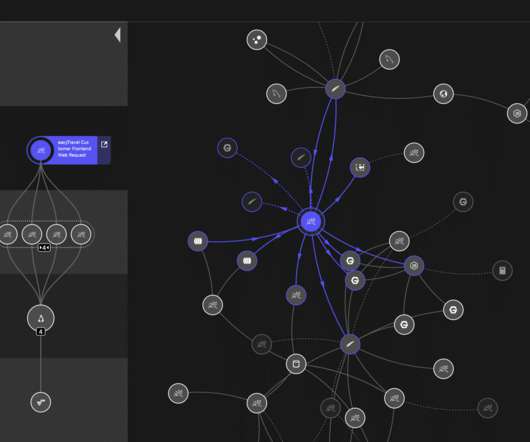
That is, relying on metrics, logs, and traces to understand what software is doing and where it’s running into snags. OpenTelemetry, the open source observability tool, has emerged as an industry-standard solution for instrumenting application telemetry data to make it observable. What is OpenTelemetry?

Metrics 185
article thumbnail

Running the OpenTelemetry demo application with Dynatrace

Dynatrace

OpenTelemetry is an exciting open source observability standard that provides a common collection of tools, APIs, and SDKs to help collect observability signals. The demo has been in active development since the summer of 2022 with Dynatrace as one of its leading contributors. OpenTelemetry demo application architecture diagram.

Insiders

Sign Up for our Newsletter

This site is protected by reCAPTCHA and the Google Privacy Policy and Terms of Service apply.

Trending Sources

article thumbnail

The road to observability with OpenTelemetry demo part 2: OpenTelemetry configuration and instrumenting applications

Dynatrace

OpenTelemetry , the open source observability tool, has become the go-to standard for instrumenting custom applications to help software developers and operations teams understand what their software is doing and where it’s running into snags. We also introduced our demo app and explained how to define the metrics and traces it uses.

article thumbnail

Performance Testing with Open Source Tools – Myths and Reality

Alex Podelko

Some time ago Federico Toledo published Performance Testing with Open Source Tools- Busting The Myths. Otherwise we wouldn’t see so many commercial tools built on the top of open source including BlazeMeter (it is ironic that the article is posted on the BlazeMeter site), Flood, and OctoPerf.

article thumbnail

Observability engineering: Getting Prometheus metrics right for Kubernetes with Dynatrace and Kepler

Dynatrace

To get a more granular look into telemetry data, many analysts rely on custom metrics using Prometheus. Named after the Greek god who brought fire down from Mount Olympus, Prometheus metrics have been transforming observability since the project’s inception in 2012. What is Prometheus?

Metrics 182
article thumbnail

The road to observability demo part 3: Collect, instrument, and analyze telemetry data automatically with Dynatrace

Dynatrace

Making applications observable—relying on metrics, logs, and traces to understand what software is doing and how it’s performing—has become increasingly important as workloads are shifting to multicloud environments. We also introduced our demo app and explained how to define the metrics and traces it uses.

Metrics 175
article thumbnail

DYOC: Agentless RUM, OpenKit, Metric ingest, and Business Analytics

Dynatrace

This year I wrote two open-source apps for Dynatrace users. Agentless RUM, OpenKit, and Metric ingest to the rescue! What insights can we gain from usage metrics that we can feed-back to our product management teams? Doing so is as simple as a click on the Create Metric button and then Pin to Dashboard.

Analytics 137