article thumbnail

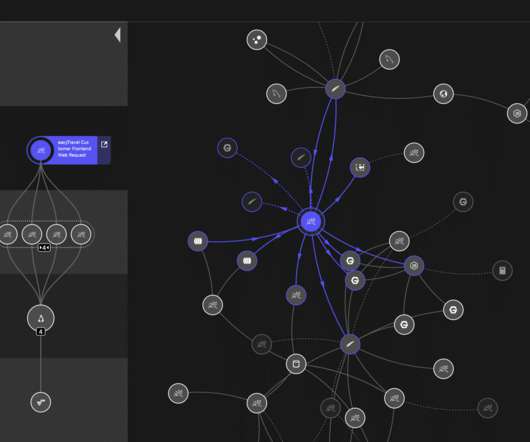
Monitoring-as-code through Dynatrace’s Open-Source Initiative

Dynatrace

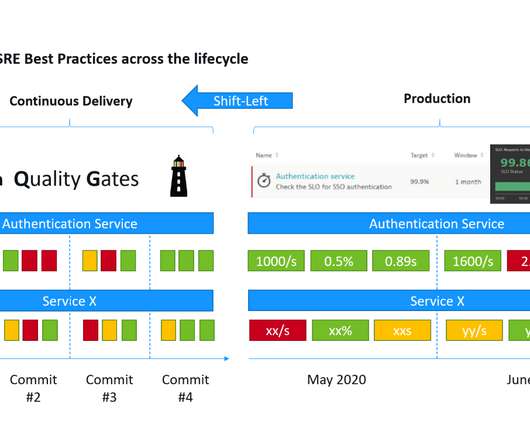
Configurations such as dashboards, alerting rules and Service Level Objective definitions are left to be created separately, and often manually. Configuring monitoring and observability is no stranger to that paradigm and it was also highlighted in the latest State of DevOps 2020 report. Monitoring-as-code requirements at Dynatrace.

article thumbnail

Performance Testing with Open Source Tools – Myths and Reality

Alex Podelko

Some time ago Federico Toledo published Performance Testing with Open Source Tools- Busting The Myths. While Federico definitely has good points there, there is some truth in these myths too. My point is that we were always going to use one of the open source solutions as a basis for our tool.

Insiders

Sign Up for our Newsletter

This site is protected by reCAPTCHA and the Google Privacy Policy and Terms of Service apply.

Trending Sources

article thumbnail

Manage your monitoring as code with Dynatrace’s HashiCorp Terraform integration

Dynatrace

HashiCorp’s Terraform is an open-source infrastructure as a code software tool that provides a consistent CLI workflow to manage hundreds of cloud services. Per HashiCorp, this codification allows infrastructure changes to be automated while keeping the definition human readable. What is monitoring as code?

Code 241
article thumbnail

OpenTelemetry observability and Dynatrace deliver actionable answers at scale

Dynatrace

If a microservice falls in the forest and all your monitoring solutions report it differently, can operators accurately trace what happened and automate a response? Different monitoring point solutions, such as Jaeger, Zipkin, Logstash, Fluentd, and StatsD, each have their own way of observing and recording such an event.

article thumbnail

Overseeing SaaS security with AWS AppFabric and Dynatrace

Dynatrace

Overseeing SaaS security and monitoring audit logs across multiple SaaS applications is complex, which often involves building and maintaining dedicated integrations for each application that can retrieve audit logs. Go to Settings -> Log Monitoring -> Events extraction and click on the Add log event button. You are all set!

AWS 244
article thumbnail

A three-step implementation guide to answer-driven SLO-based release validation

Dynatrace

The innovative technology powering these recent and future use cases comes from Keptn , our recognized CNCF open-source project. If you want more information on Keptn, then I suggest joining the Keptn Open Source community and help us drive innovation that benefits both the open-source project and Dynatrace Cloud Automation Solution.

DevOps 244
article thumbnail

Dynatrace observability is now available for Red Hat OpenShift on the IBM® Power® architecture

Dynatrace

Dynatrace introduced the Dynatrace Operator, built on the open source project Operator Framework, in late 2018. Additionally, Dynatrace integrates seamlessly with cloud-native technologies and services, such as Istio and Prometheus, further enhancing its monitoring capabilities.