article thumbnail

Observability engineering: Getting Prometheus metrics right for Kubernetes with Dynatrace and Kepler

Dynatrace

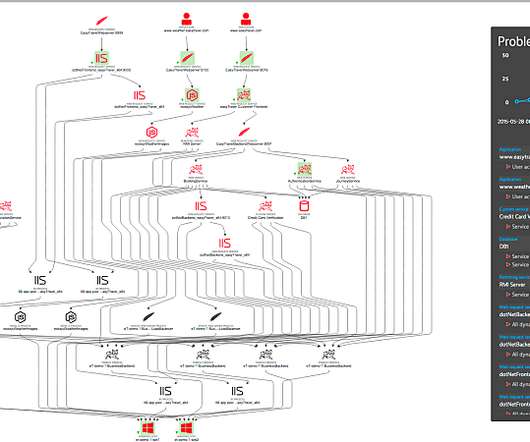
To get a more granular look into telemetry data, many analysts rely on custom metrics using Prometheus. Named after the Greek god who brought fire down from Mount Olympus, Prometheus metrics have been transforming observability since the project’s inception in 2012.
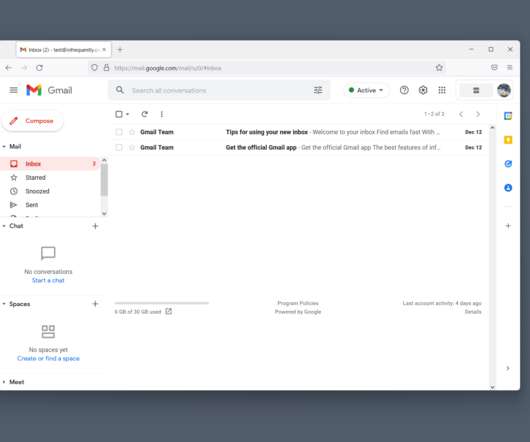
Metrics 176
article thumbnail

New web performance insights with additional metrics and enhanced Visually complete for synthetic monitors

Dynatrace

Synthetic monitors are also the perfect tool to monitor performance baselines. This clean-room, lab-like environment allows you to react to slight changes in performance. It also gives you the first indication of whether a new deployment of your application or API leads to a performance improvement or, perhaps, a regression.

Metrics 213
Insiders

Sign Up for our Newsletter

This site is protected by reCAPTCHA and the Google Privacy Policy and Terms of Service apply.

Trending Sources

article thumbnail

9 key DevOps metrics for success

Dynatrace

The emerging concepts of working with DevOps metrics and DevOps KPIs have really come a long way. DevOps metrics to help you meet your DevOps goals. Like any IT or business project, you’ll need to track critical key metrics. Here are nine key DevOps metrics and DevOps KPIs that will help you be successful.

DevOps 198
article thumbnail

The road to observability with OpenTelemetry demo part 1: Identifying metrics and traces

Dynatrace

That is, relying on metrics, logs, and traces to understand what software is doing and where it’s running into snags. In addition to tracing, observability also defines two other key concepts, metrics and logs. When software runs in a monolithic stack on on-site servers, observability is manageable enough. What is OpenTelemetry?

Metrics 179
article thumbnail

How multicloud observability boosts cloud performance at Tractor Supply Co.

Dynatrace

Managing cloud performance is increasingly challenging for organizations that spread workloads across a greater variety of platforms. Moreover, organizations have to balance maintaining security, retaining cloud management expertise, and managing infrastructure performance. Rural lifestyle retail giant Tractor Supply Co.

Cloud 170
article thumbnail

Best practices for Fluent Bit 3.0

Dynatrace

Fluent Bit is a telemetry agent designed to receive data (logs, traces, and metrics), process or modify it, and export it to a destination. However, you can also use Fluent Bit as a processor because you can perform various actions on the data. Observability: Elevating Logs, Metrics, and Traces! What’s new in Fluent Bit 3.0

article thumbnail

Simplify observability for all your custom metrics (Part 1: StatsD)

Dynatrace

Welcome to the blog series where we give you a deeper dive into the latest awesomeness around Dynatrace : how we bring scale, zero configuration, automatic AI driven alerting, and root cause analysis to all your custom metrics, including open source observability frameworks like StatsD, Telegraf, and Prometheus.

Metrics 156