Remove Course Remove Infrastructure Remove Systems Remove Traffic
article thumbnail

What is a Distributed Storage System

Scalegrid

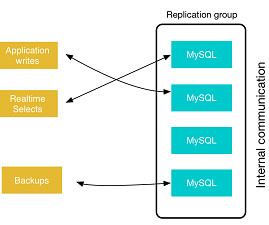
A distributed storage system is foundational in today’s data-driven landscape, ensuring data spread over multiple servers is reliable, accessible, and manageable. This guide delves into how these systems work, the challenges they solve, and their essential role in businesses and technology.

Storage 130
article thumbnail

Easily monitor your entire infrastructure with Dynatrace Synthetic monitors

Dynatrace

In those cases, what should you do if you want to be proactive and ensure that your infrastructure is always up and running? You could of course create a custom device in Dynatrace and send data to it using our API or an ActiveGate extension. Easy and flexible infrastructure monitoring. Third-party synthetic monitors.

Insiders

Sign Up for our Newsletter

This site is protected by reCAPTCHA and the Google Privacy Policy and Terms of Service apply.

Trending Sources

article thumbnail

What is application security monitoring?

Dynatrace

Application security monitoring is the practice of monitoring and analyzing applications or software systems to detect vulnerabilities, identify threats, and mitigate attacks. Forensics focuses on the systemic investigation and analysis of digital evidence to determine root causes.

article thumbnail

The Ultimate Guide to Database High Availability

Percona

Defining high availability In general terms, high availability refers to the continuous operation of a system with little to no interruption to end users in the event of hardware or software failures, power outages, or other disruptions. Load balancers can detect when a component is not responding and put traffic redirection in motion.

article thumbnail

Is working-from-home affecting productivity? Use Dynatrace to find out and optimize!

Dynatrace

Are the systems we rely on every day as reliable via the home internet connection? Example #1 Order System: No change in user or buyers’ behavior. Both types of users mentioned access the same system, the only difference is that employees access it via the internal network and externals through a public exposed URL.

DevOps 172
article thumbnail

The road to observability demo part 3: Collect, instrument, and analyze telemetry data automatically with Dynatrace

Dynatrace

Think about items such as general system metrics (for example, CPU utilization, free memory, number of services), the connectivity status, details of our web server, or even more granular in-application tasks like database queries. DNS query time indicates the average response times of DNS requests across the system.

Metrics 168
article thumbnail

Seamlessly Swapping the API backend of the Netflix Android app

The Netflix TechBlog

Over the course of this post, we will talk about our approach to this migration, the strategies that we employed, and the tools we built to support this. The big difference from the monolith, though, is that this is now a standalone service deployed as a separate “application” (service) in our cloud infrastructure.

Latency 233