Remove Code Remove Java Remove Metrics Remove Systems
article thumbnail

AI-driven analysis of Spring Micrometer metrics in context, with typology at scale

Dynatrace

One of these solutions is Micrometer which provides 17+ pre-instrumented JVM-based frameworks for data collection and enables instrumentation code with a vendor-neutral API. Micrometer is used for instrumenting both out-of-the-box and custom metrics from Spring Boot applications. That’s a large amount of data to handle.

Metrics 200
article thumbnail

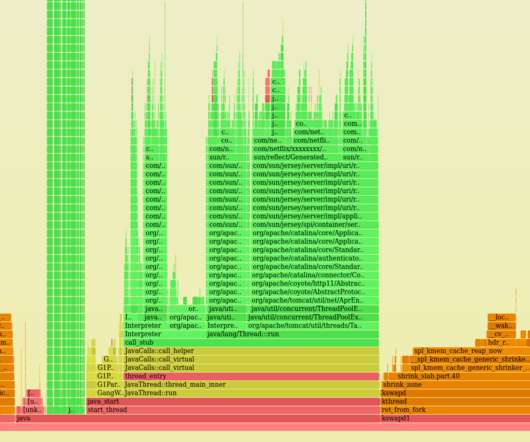
Optimizing Java XPath CPU and memory overhead by 98%

Dynatrace

The system saw up to 800 application requests per second – far more than anticipated. More worrisome was a spike in CPU usage, resulting in severe service disruption as backend processing systems crashed due to the spike in load. Therefore, it was unsurprising to see a huge spike in traffic for Family Visa enrollment via Metrash.

Java 216
Insiders

Sign Up for our Newsletter

This site is protected by reCAPTCHA and the Google Privacy Policy and Terms of Service apply.

Trending Sources

article thumbnail

The road to observability with OpenTelemetry demo part 1: Identifying metrics and traces

Dynatrace

Anyone who’s concerned with developing, delivering, and operating software knows the importance of making software and the systems it runs on observable. That is, relying on metrics, logs, and traces to understand what software is doing and where it’s running into snags. Why should I adopt observability?

Metrics 174
article thumbnail

AI-driven analysis of Spring Micrometer metrics in context, with topology at scale

Dynatrace

One of these solutions is Micrometer which provides 17+ pre-instrumented JVM-based frameworks for data collection and enables instrumentation code with a vendor-neutral API. Micrometer is used for instrumenting both out-of-the-box and custom metrics from Spring Boot applications. That’s a large amount of data to handle.
Metrics 130
article thumbnail

AI-driven analysis of Spring Micrometer metrics in context, with topology at scale

Dynatrace

One of these solutions is Micrometer which provides 17+ pre-instrumented JVM-based frameworks for data collection and enables instrumentation code with a vendor-neutral API. Micrometer is used for instrumenting both out-of-the-box and custom metrics from Spring Boot applications. That’s a large amount of data to handle.

Metrics 130
article thumbnail

What is? OpenTelemetry??An open-source standard for logs, metrics, and traces

Dynatrace

Loosely defined, observability is the ability to understand what’s happening inside a system from the knowledge of the external data it produces, which are usually logs, metrics, and traces. Logs, metrics, and traces make up the bulk of all telemetry data. To appreciate what OTel does, it helps to understand observability.

article thumbnail

Enhanced AI model observability with Dynatrace and Traceloop OpenLLMetry

Dynatrace

By using OpenLLMetry and Dynatrace, anyone can get complete visibility into their system, including gen-AI parts with 5 minutes of work.” OpenTelemetry has become a standard for collecting traces, metrics, and logs. “Engineers today lack an easy way to track the tokens and prompt usage of their LLM applications in production.