article thumbnail

Crucial Redis Monitoring Metrics You Must Watch

Scalegrid

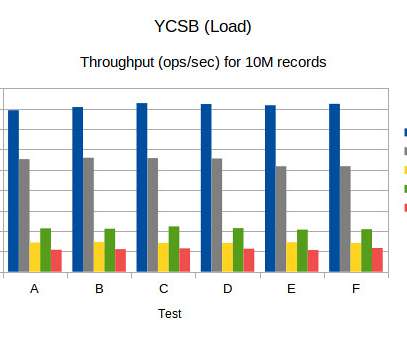
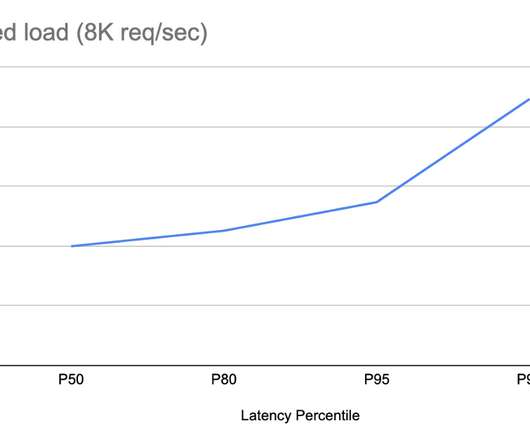
Key Takeaways Critical performance indicators such as latency, CPU usage, memory utilization, hit rate, and number of connected clients/slaves/evictions must be monitored to maintain Redis’s high throughput and low latency capabilities. It can achieve impressive performance, handling up to 50 million operations per second.

Metrics 130
article thumbnail

Benchmark (YCSB) numbers for Redis, MongoDB, Couchbase2, Yugabyte and BangDB

High Scalability

This article is to simply report the YCSB bench test results in detail for five NoSQL databases namely Redis, MongoDB, Couchbase, Yugabyte and BangDB and compare the result side by side. I have also used the default six test scenarios as defined by the YCSB framework. I have restricted it to 10M records for each test.

Insiders

Sign Up for our Newsletter

This site is protected by reCAPTCHA and the Google Privacy Policy and Terms of Service apply.

Trending Sources

article thumbnail

Dynatrace accelerates business transformation with new AI observability solution

Dynatrace

The RAG process begins by summarizing and converting user prompts into queries that are sent to a search platform that uses semantic similarities to find relevant data in vector databases, semantic caches, or other online data sources. To observe model drift and accuracy, companies can use holdout evaluation sets for comparison to model data.

Cache 204
article thumbnail

Migrating Critical Traffic At Scale with No Downtime?—?Part 1

The Netflix TechBlog

This blog post will provide a detailed analysis of replay traffic testing, a versatile technique we have applied in the preliminary validation phase for multiple migration initiatives. In this testing strategy, we execute a copy (replay) of production traffic against a system’s existing and new versions to perform relevant validations.

Traffic 339
article thumbnail

Dynatrace supports SnapStart for Lambda as an AWS launch partner

Dynatrace

The new Amazon capability enables customers to improve the startup latency of their functions from several seconds to as low as sub-second (up to 10 times faster) at P99 (the 99th latency percentile). This can cause latency outliers and may lead to a poor end-user experience for latency-sensitive applications.

Lambda 225
article thumbnail

The Three Cs: Concatenate, Compress, Cache

CSS Wizardry

Caching them at the other end: How long should we cache files on a user’s device? In one test, I concatenated it all into one big file, and the other had the library split into 12 files. Read the complete test methodology. 4,362ms of cumulative latency; 240ms of cumulative download. That’s almost 22× more!

Cache 291
article thumbnail

Self-Host Your Static Assets

CSS Wizardry

Users might already have the file cached. If website-a.com links to [link] , and a user goes from there to website-b.com who also links to [link] , then the user will already have that file in their cache. On a slower, higher-latency connection, the story is much, mush worse. Penalty: Caching. All completely avoidable.

Cache 274