article thumbnail

Seeing through hardware counters: a journey to threefold performance increase

The Netflix TechBlog

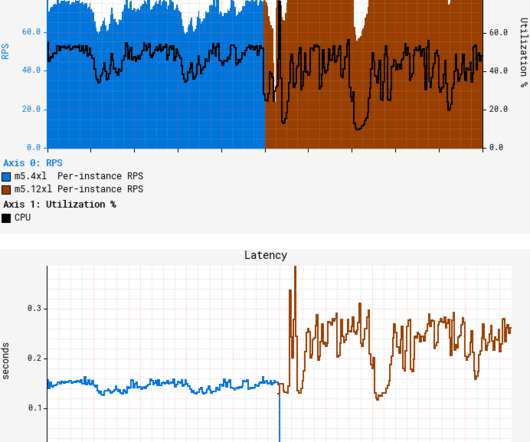
We also see much higher L1 cache activity combined with 4x higher count of MACHINE_CLEARS. a usage pattern occurring when 2 cores reading from / writing to unrelated variables that happen to share the same L1 cache line. Cache line is a concept similar to memory page?—? Thread 0’s cache in this example.

Hardware 363
article thumbnail

Crucial Redis Monitoring Metrics You Must Watch

Scalegrid

You will need to know which monitoring metrics for Redis to watch and a tool to monitor these critical server metrics to ensure its health. Redis returns a big list of database metrics when you run the info command on the Redis shell. You can pick a smart selection of relevant metrics from these.

Metrics 130
Insiders

Sign Up for our Newsletter

This site is protected by reCAPTCHA and the Google Privacy Policy and Terms of Service apply.

Trending Sources

article thumbnail

Kubernetes in the wild report 2023

Dynatrace

On-premises data centers invest in higher capacity servers since they provide more flexibility in the long run, while the procurement price of hardware is only one of many cost factors. Of the organizations in the Kubernetes survey, 71% run databases and caches in Kubernetes, representing a +48% year-over-year increase.

article thumbnail

Redis® Monitoring Strategies for 2024

Scalegrid

Buckle up as we delve into the world of Redis® monitoring, exploring the most important Redis® metrics, discussing essential tools, and even peering into the future of Redis® performance management. Identifying key Redis® metrics such as latency, CPU usage, and memory metrics is crucial for effective Redis monitoring.

Strategy 130
article thumbnail

MySQL Performance Tuning 101: Key Tips to Improve MySQL Database Performance

Percona

This results in expedited query execution, reduced resource utilization, and more efficient exploitation of the available hardware resources. This not only enhances performance but also enables you to make more efficient use of your hardware resources, potentially resulting in cost savings on infrastructure.

Tuning 52
article thumbnail

MySQL Capacity Planning

Percona

Hardware considerations The first thing we have to consider here is the resources that the underlying host provides to the database. Global caches like the InnoDB buffer pool and MyISAM key cache and session-level caches like the sort buffer, join buffer, random read buffer, etc. Do these queries use more caches?

Traffic 89
article thumbnail

MySQL Key Performance Indicators (KPI) With PMM

Percona

This includes metrics such as query execution time, the number of queries executed per second, and the utilization of query cache and adaptive hash index. query cache: Disable (query_cache_size: 0, query_cache_type:OFF) innodb_adaptive_hash_index: Check adaptive hash index usage to determine its efficiency.