Remove Blog Remove Infrastructure Remove Metrics Remove Network
article thumbnail

AI-powered DNS request tracking extends infrastructure observability for high quality network traffic

Dynatrace

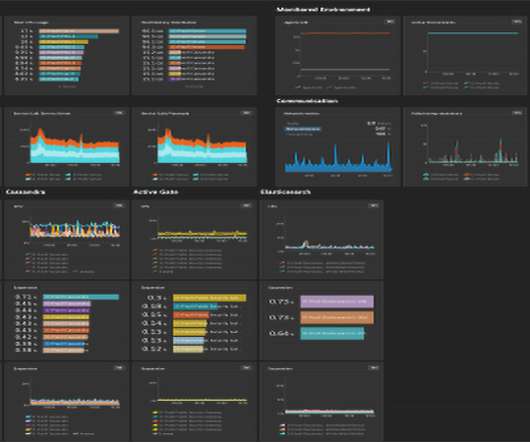
The Dynatrace Software Intelligence Platform gives you a complete Infrastructure Monitoring solution for the monitoring of cloud platforms and virtual infrastructure, along with log monitoring and AIOps. Ensure high quality network traffic by tracking DNS requests out-of-the-box.

Traffic 264
article thumbnail

Extend infrastructure observability with JMX Extensions and additional full-stack metrics

Dynatrace

Infrastructure exists to support the backing services that are collectively perceived by users to be your web application. Issues that manifest themselves as performance degradation on a user’s device can often be traced back to underlying infrastructure issues. Monitor additional metrics. Dynatrace news.

Insiders

Sign Up for our Newsletter

This site is protected by reCAPTCHA and the Google Privacy Policy and Terms of Service apply.

Trending Sources

article thumbnail

Observability engineering: Getting Prometheus metrics right for Kubernetes with Dynatrace and Kepler

Dynatrace

To get a more granular look into telemetry data, many analysts rely on custom metrics using Prometheus. Named after the Greek god who brought fire down from Mount Olympus, Prometheus metrics have been transforming observability since the project’s inception in 2012.

Metrics 178
article thumbnail

How to collect Prometheus metrics in Dynatrace

Dynatrace

Dynatrace has recently extended its Kubernetes operator by adding a new feature, the Prometheus OpenMetrics Ingest , which enables you to import Prometheus metrics in Dynatrace and build SLO and anomaly detection dashboards with Prometheus data. Here we’ll explore how to collect Prometheus metrics and what you can achieve with them.

Metrics 200
article thumbnail

Building Netflix’s Distributed Tracing Infrastructure

The Netflix TechBlog

In our previous blog post we introduced Edgar, our troubleshooting tool for streaming sessions. Now let’s look at how we designed the tracing infrastructure that powers Edgar. This insight led us to build Edgar: a distributed tracing infrastructure and user experience.

article thumbnail

AI-powered infrastructure monitoring for your SAP HANA database (Preview)

Dynatrace

Enable the Davis AI causation engine to automatically analyze every metric. In response to customer feedback, we’ve distilled the vital information provided within HANA DB performance views down to a short list of metrics that offer comprehensive, detailed, and reliable insights into HANA DB performance.

article thumbnail

Who will watch the watchers? Extended infrastructure observability for WSO2 API Manager

Dynatrace

Sure, cloud infrastructure requires comprehensive performance visibility, as Dynatrace provides , but the services that leverage cloud infrastructures also require close attention. Extend infrastructure observability to WSO2 API Manager. Looking at the key metrics of the deployment does not reveal anything out of the ordinary.