Remove Benchmarking Remove Metrics Remove Network Remove Strategy
article thumbnail

Plan Your Multi Cloud Strategy

Scalegrid

A well-planned multi cloud strategy can seriously upgrade your business’s tech game, making you more agile. Key Takeaways Multi-cloud strategies have become increasingly popular due to the need for flexibility, innovation, and the avoidance of vendor lock-in. Thinking about going multi-cloud?

Strategy 130
article thumbnail

Crucial Redis Monitoring Metrics You Must Watch

Scalegrid

You will need to know which monitoring metrics for Redis to watch and a tool to monitor these critical server metrics to ensure its health. Redis returns a big list of database metrics when you run the info command on the Redis shell. You can pick a smart selection of relevant metrics from these.

Metrics 130
Insiders

Sign Up for our Newsletter

This site is protected by reCAPTCHA and the Google Privacy Policy and Terms of Service apply.

Trending Sources

article thumbnail

IT carbon footprint: Dynatrace Carbon Impact and Optimization app helps organizations measure cloud computing carbon footprint

Dynatrace

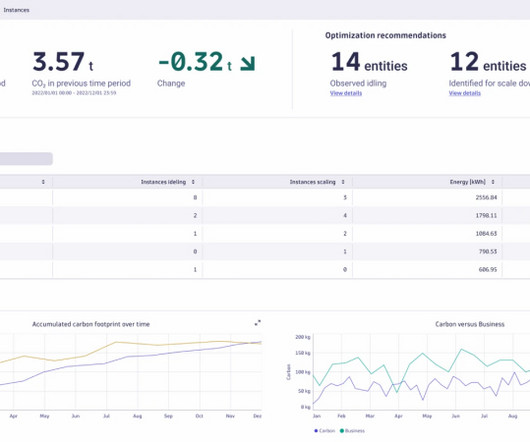
The app’s advanced algorithms and real-time data analytics translate utilization metrics into their CO2 equivalent (CO2e). These metrics include CPU, memory, disk, and network I/O. As a result, this baseline measurement has become an important component of our sustainability strategy.

Energy 233
article thumbnail

What is infrastructure monitoring and why is it mission-critical in the new normal?

Dynatrace

IT infrastructure is the heart of your digital business and connects every area – physical and virtual servers, storage, databases, networks, cloud services. for unplanned downtime, resource saturation, network intrusion. AI-assistance: Use AI to detect anomalies and benchmark your system. Dynatrace news.

article thumbnail

Real user monitoring vs. synthetic monitoring: Understanding best practices

Dynatrace

RUM gathers information on a variety of performance metrics. Data collected on page load events, for example, can include navigation start (when performance begins to be measured), request start (right before the user makes a request from the server), and speed index metrics (measure page load speed). Real user monitoring limitations.

article thumbnail

Web Performance for Product Managers

Speed Curve

What do the different metrics mean? While the focus in most cases tends to be directed toward front-end developers, it's important to remember the back-end as well if you see higher than normal start render times or increases in more basic metrics like time to first byte. What do the different metrics mean? Let's get started.

article thumbnail

Ten years of page bloat: What have we learned?

Speed Curve

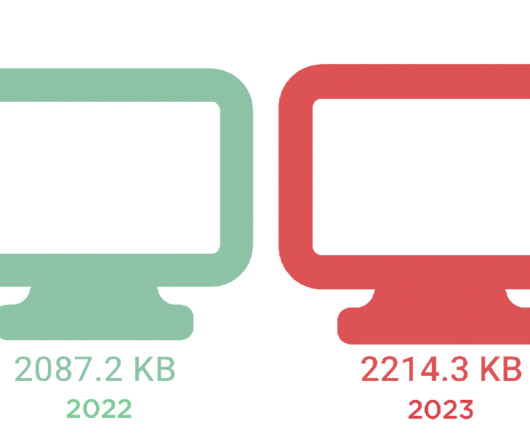
But pages keep getting bigger and more complex year over year – and this increasing size and complexity is not fully mitigated by faster devices and networks, or by our hard-working browsers. And we need to have strategies in place to understand and manage our pages. Clearly we need to keep talking about it.

Mobile 145