Remove Benchmarking Remove Metrics Remove Network Remove Open Source
article thumbnail

Container security: What it is, why it’s tricky, and how to do it right

Dynatrace

Application developers commonly leverage open-source software when building containerized applications. In fact, the market research firm Forrester says that the average container image is comprised of 70% open-source software.[1] 1] And unfortunately, open-source software is often fraught with security vulnerabilities.

article thumbnail

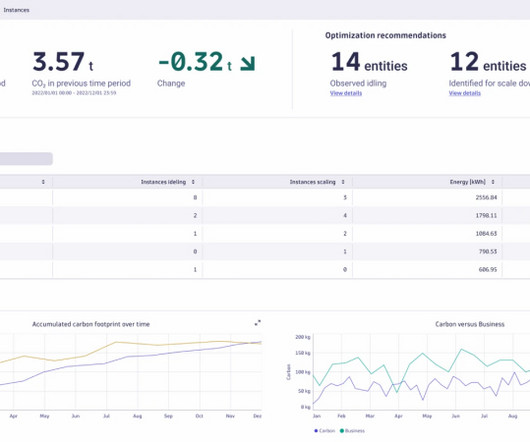
IT carbon footprint: Dynatrace Carbon Impact and Optimization app helps organizations measure cloud computing carbon footprint

Dynatrace

Developed using guidance from the Sustainable Digital Infrastructure Alliance (SDIA) and expanding on formulas from the open source project Cloud Carbon Footprint , Carbon Impact measures and reports the IT carbon footprint of all Dynatrace-monitored hosts across an organization’s entire hybrid and multicloud environment in a single interface.

Energy 239
Insiders

Sign Up for our Newsletter

This site is protected by reCAPTCHA and the Google Privacy Policy and Terms of Service apply.

Trending Sources

article thumbnail

Grafana Dashboards: A PoC Implementing the PostgreSQL Extension pg_stat_monitor

Percona

This PoC demonstrates how to install and configure pg_stat_monitor in order to extract useful and actionable metrics from a PostgreSQL database and display them on a Grafana dashboard. This allows for much better data accuracy, especially in the case of high-resolution or unreliable networks.

article thumbnail

Five-nines availability: Always-on infrastructure delivers system availability during the holidays’ peak loads

Dynatrace

Five-nines availability: The ultimate benchmark of system availability. Instead, to speed up response times, applications are now processing most data at the network’s perimeter, closest to the data’s origin. But is five nines availability attainable? Each decimal point closer to 100 equals higher uptime.

article thumbnail

How to Assess MySQL Performance

HammerDB

As database performance is heavily influenced by the performance of storage, network, memory, and processors, we must understand the upper limit of these key components. For the network, we can use Iperf to assess the network bandwidth between the client and the database server to ensure it will be enough to meet our peak requirement.

article thumbnail

Netflix at AWS re:Invent 2019

The Netflix TechBlog

In this session, we discuss the technologies used to run a global streaming company, growing at scale, billions of metrics, benefits of chaos in production, and how culture affects your velocity and uptime. In order to maintain performance, benchmarking is a vital part of our system’s lifecycle.

AWS 100