Remove Availability Remove Hardware Remove Latency Remove Software
article thumbnail

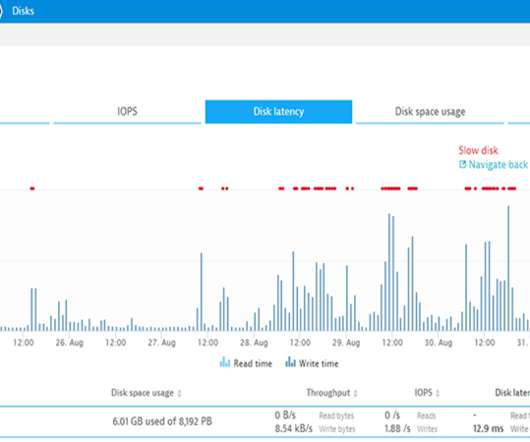
Optimize your environment: Unveiling Dynatrace Hyper-V extension for enhanced performance and efficient troubleshooting

Dynatrace

It enables multiple operating systems to run simultaneously on the same physical hardware and integrates closely with Windows-hosted services. Therefore, they experience how the application code functions and how the application operations depend on the underlying hardware resources and the operating system managed by Hyper-V.

article thumbnail

Cloud infrastructure monitoring in action: Dynatrace on Dynatrace

Dynatrace

As of September 2020, we run 51 clusters on 1100 EC2 instances distributed across six AWS Regions ensuring that all our users can leverage the Dynatrace Software Intelligence Platform to monitor their hybrid-multi cloud environments. Since we moved to AWS in May 2014 we have had an availability of 99.95%!

Insiders

Sign Up for our Newsletter

This site is protected by reCAPTCHA and the Google Privacy Policy and Terms of Service apply.

Trending Sources

article thumbnail

Redis® Monitoring Strategies for 2024

Scalegrid

Identifying key Redis® metrics such as latency, CPU usage, and memory metrics is crucial for effective Redis monitoring. To monitor Redis® instances effectively, collect Redis metrics focusing on cache hit ratio, memory allocated, and latency threshold.

Strategy 130
article thumbnail

An open-source benchmark suite for microservices and their hardware-software implications for cloud & edge systems

The Morning Paper

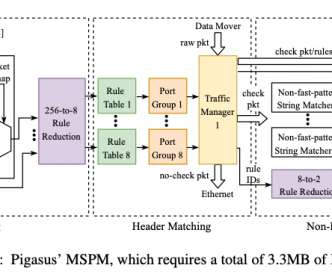
An open-source benchmark suite for microservices and their hardware-software implications for cloud & edge systems Gan et al., It’s a pretty impressive effort to pull together and make available in open source (not yet available as I write this) such a suite, and I’m sure explains much of the long list of 24 authors on this paper.

article thumbnail

Crucial Redis Monitoring Metrics You Must Watch

Scalegrid

Key Takeaways Critical performance indicators such as latency, CPU usage, memory utilization, hit rate, and number of connected clients/slaves/evictions must be monitored to maintain Redis’s high throughput and low latency capabilities. Similarly, an increased throughput signifies an intensive workload on a server and a larger latency.

Metrics 130
article thumbnail

What is serverless computing? Driving efficiency without sacrificing observability

Dynatrace

This allows teams to sidestep much of the cost and time associated with managing hardware, platforms, and operating systems on-premises, while also gaining the flexibility to scale rapidly and efficiently. Every time the trigger executes, the function runs on an available resource. This creates latency when they need to restart.

article thumbnail

What is ITOps? Why IT operations is more crucial than ever in a multicloud world

Dynatrace

Besides the traditional system hardware, storage, routers, and software, ITOps also includes virtual components of the network and cloud infrastructure. Although modern cloud systems simplify tasks, such as deploying apps and provisioning new hardware and servers, hybrid cloud and multicloud environments are often complex.