Remove Availability Remove Efficiency Remove Latency Remove Tuning
article thumbnail

Why applying chaos engineering to data-intensive applications matters

Dynatrace

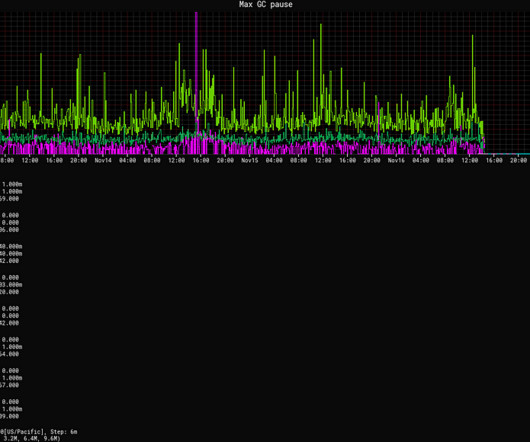
Such frameworks support software engineers in building highly scalable and efficient applications that process continuous data streams of massive volume. Stream processing systems, designed for continuous, low-latency processing, demand swift recovery mechanisms to tolerate and mitigate failures effectively.

article thumbnail

Bending pause times to your will with Generational ZGC

The Netflix TechBlog

Reduced tail latencies In both our GRPC and DGS Framework services, GC pauses are a significant source of tail latencies. For a given CPU utilization target, ZGC improves both average and P99 latencies with equal or better CPU utilization when compared to G1. No explicit tuning has been required to achieve these results.

Latency 228
Insiders

Sign Up for our Newsletter

This site is protected by reCAPTCHA and the Google Privacy Policy and Terms of Service apply.

Trending Sources

article thumbnail

Crucial Redis Monitoring Metrics You Must Watch

Scalegrid

Key Takeaways Critical performance indicators such as latency, CPU usage, memory utilization, hit rate, and number of connected clients/slaves/evictions must be monitored to maintain Redis’s high throughput and low latency capabilities. These essential data points heavily influence both stability and efficiency within the system.

Metrics 130
article thumbnail

MySQL Performance Tuning 101: Key Tips to Improve MySQL Database Performance

Percona

While there is no magic bullet for MySQL performance tuning, there are a few areas that can be focused on upfront that can dramatically improve the performance of your MySQL installation. What are the Benefits of MySQL Performance Tuning? A finely tuned database processes queries more efficiently, leading to swifter results.

Tuning 52
article thumbnail

Best MySQL DigitalOcean Performance – ScaleGrid vs. DigitalOcean Managed Databases

Scalegrid

Compare Latency. On average, ScaleGrid achieves almost 30% lower latency over DigitalOcean for the same deployment configurations. In this benchmark, we measure MySQL throughput in terms of queries per second (QPS) to measure our query efficiency. Read-Intensive Latency Benchmark. Balanced Workload Latency Benchmark.

Database 217
article thumbnail

Automated observability, security, and reliability at scale

Dynatrace

However, scaling up software development requires more tools along the software product lifecycle, which must be configured promptly and efficiently. Efficient environment configuration at scale One of software engineers’ most significant challenges is managing the numerous tools and technologies required for the software product lifecycle.

article thumbnail

Mastering MongoDB® Timeout Settings

Scalegrid

The implication resulting from exceeding the Server Selection Timeout limit can prove damaging for MongoDB’s efficiency, leading to a selection error which is about time-out exceeding the allowed limits. Fine-tuning these settings would lead to improved performance and provide an enhanced user experience. <p>The

Java 130