article thumbnail

Bending pause times to your will with Generational ZGC

The Netflix TechBlog

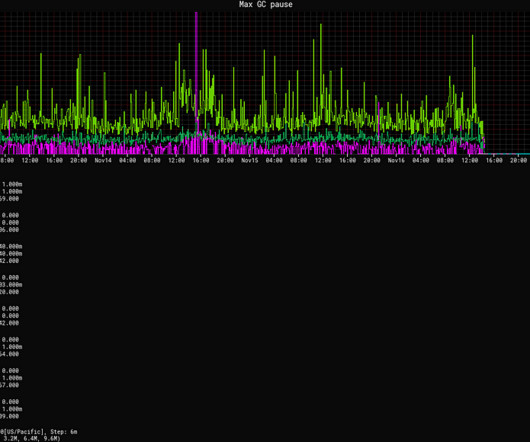
Reduced tail latencies In both our GRPC and DGS Framework services, GC pauses are a significant source of tail latencies. For a given CPU utilization target, ZGC improves both average and P99 latencies with equal or better CPU utilization when compared to G1. No explicit tuning has been required to achieve these results.

Latency 228
article thumbnail

Migrating Critical Traffic At Scale with No Downtime?—?Part 1

The Netflix TechBlog

Migrating Critical Traffic At Scale with No Downtime — Part 1 Shyam Gala , Javier Fernandez-Ivern , Anup Rokkam Pratap , Devang Shah Hundreds of millions of customers tune into Netflix every day, expecting an uninterrupted and immersive streaming experience. Logging is selective to cases where the old and new responses do not match.

Traffic 339
Insiders

Sign Up for our Newsletter

This site is protected by reCAPTCHA and the Google Privacy Policy and Terms of Service apply.

Trending Sources

article thumbnail

Optimizing your Kubernetes clusters without breaking the bank

Dynatrace

However, setting the right parameters for Kubernetes clusters to ensure application availability, performance, and resilience while avoiding overspending isn’t a walk in the park. Tuning thousands of parameters has become an impossible task to achieve via a manual and time-consuming approach. The Akamas approach. lower than 2%.).

Latency 209
article thumbnail

MySQL Performance Tuning 101: Key Tips to Improve MySQL Database Performance

Percona

While there is no magic bullet for MySQL performance tuning, there are a few areas that can be focused on upfront that can dramatically improve the performance of your MySQL installation. What are the Benefits of MySQL Performance Tuning? A finely tuned database processes queries more efficiently, leading to swifter results.

Tuning 52
article thumbnail

Crucial Redis Monitoring Metrics You Must Watch

Scalegrid

Key Takeaways Critical performance indicators such as latency, CPU usage, memory utilization, hit rate, and number of connected clients/slaves/evictions must be monitored to maintain Redis’s high throughput and low latency capabilities. Similarly, an increased throughput signifies an intensive workload on a server and a larger latency.

Metrics 130
article thumbnail

Comparing PostgreSQL DigitalOcean Performance & Pricing – ScaleGrid vs. DigitalOcean Managed Databases

Scalegrid

Compare Latency. lower latency compared to DigitalOcean for PostgreSQL. Now, let’s take a look at the throughput and latency performance of our comparison. Next, we are going to test and compare the latency performance between ScaleGrid and DigitalOcean for PostgreSQL. PostgreSQL DigitalOcean Latency Averages (ms).

Database 230
article thumbnail

Migrating Netflix to GraphQL Safely

The Netflix TechBlog

To determine customer impact, we could compare various metrics such as error rates, latencies, and time to render. The Replay Testing framework leverages the @override directive available in GraphQL Federation. The AB experiment results hinted that GraphQL’s correctness was not up to par with the legacy system. How does it work?

Traffic 353