article thumbnail

Effective Log Data Analysis With Amazon CloudWatch: Harnessing Machine Learning

DZone

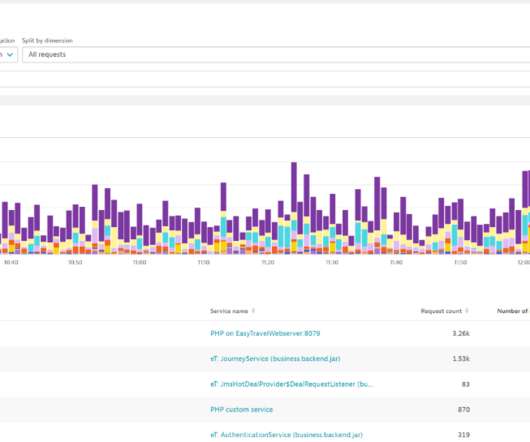
Logs can include a wide variety of data, including system events, transaction data, user activities, web browser logs, errors, and performance metrics. It offers a faster, more insightful, and automated log data analysis. In today's cloud computing world, all types of logging data are extremely valuable.

Analytics 269
article thumbnail

Best practices and key metrics for improving mobile app performance

Dynatrace

Mobile applications (apps) are an increasingly important channel for reaching customers, but the distributed nature of mobile app platforms and delivery networks can cause performance problems that leave users frustrated, or worse, turning to competitors. What is mobile app performance? Some of the most important KPIs are listed below.

Insiders

Sign Up for our Newsletter

This site is protected by reCAPTCHA and the Google Privacy Policy and Terms of Service apply.

Trending Sources

article thumbnail

OpenTelemetry services analysis and endpoint detection made easier with Dynatrace unified services

Dynatrace

Great news: OpenTelemetry endpoint detection, analyzing OpenTelemetry services, and visualizing Istio service mesh metrics just got easier. As a CNCF open source incubating project, OpenTelemetry provides a standardized set of APIs, libraries, agents, instrumentation, and specifications for logging, metrics, and tracing.

Metrics 165
article thumbnail

Dynatrace simplifies OpenTelemetry metric collection for context-aware AI analytics

Dynatrace

The release candidate of OpenTelemetry metrics was announced earlier this year at Kubecon in Valencia, Spain. Since then, organizations have embraced OTLP as an all-in-one protocol for observability signals, including metrics, traces, and logs, which will also gain Dynatrace support in early 2023.

Analytics 276
article thumbnail

Crucial Redis Monitoring Metrics You Must Watch

Scalegrid

Redis® is an in-memory database that provides blazingly fast performance. This makes it a compelling alternative to disk-based databases when performance is a concern. You might already use ScaleGrid hosting for Redis hosting to power your performance-sensitive applications.

Metrics 130
article thumbnail

Multidimensional analysis 2.0: Analyze, chart, and report on microservices-based metrics without code changes

Dynatrace

In an existing application landscape, however, it can be difficult to get to those metrics. Dynatrace customers have the ability to leverage PurePath distributed tracing functionality in driving adhoc multidimensional analysis (MDA) on any kind of data available within their microservices. Here’s how Dynatrace customers do it.

Metrics 158
article thumbnail

Observability engineering: Getting Prometheus metrics right for Kubernetes with Dynatrace and Kepler

Dynatrace

To get a more granular look into telemetry data, many analysts rely on custom metrics using Prometheus. Named after the Greek god who brought fire down from Mount Olympus, Prometheus metrics have been transforming observability since the project’s inception in 2012.

Metrics 175