Remove Analysis Remove Metrics Remove Monitoring Remove Performance
article thumbnail

Best practices and key metrics for improving mobile app performance

Dynatrace

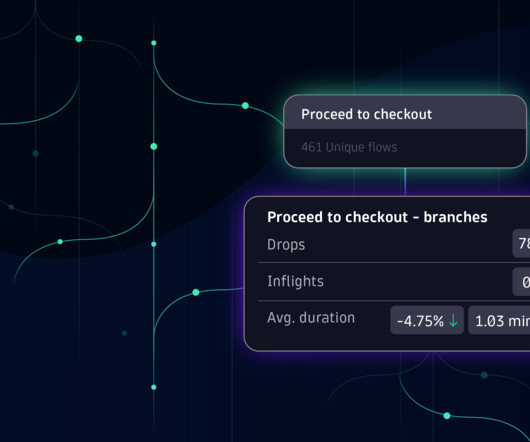
Mobile applications (apps) are an increasingly important channel for reaching customers, but the distributed nature of mobile app platforms and delivery networks can cause performance problems that leave users frustrated, or worse, turning to competitors. What is mobile app performance? Some of the most important KPIs are listed below.

article thumbnail

Crucial Redis Monitoring Metrics You Must Watch

Scalegrid

Redis® is an in-memory database that provides blazingly fast performance. This makes it a compelling alternative to disk-based databases when performance is a concern. You might already use ScaleGrid hosting for Redis hosting to power your performance-sensitive applications.

Metrics 130
Insiders

Sign Up for our Newsletter

This site is protected by reCAPTCHA and the Google Privacy Policy and Terms of Service apply.

Trending Sources

article thumbnail

Easily monitor IBM i with updated Dynatrace extension

Dynatrace

Gaining knowledge about IBM i performance can be a challenging and pricey task. Additionally, certain tools require auxiliary services to gather performance data before it can be examined and queried. It then collects performance data using existing database services running on your system. It’s all monitored remotely !

article thumbnail

Container monitoring for VA Platform One helps VA achieve workload performance

Dynatrace

Dynatrace container monitoring supports customers as they collect metrics, traces, logs, and other observability-enabled data to improve the health and performance of containerized applications. The post Container monitoring for VA Platform One helps VA achieve workload performance appeared first on Dynatrace news.

article thumbnail

New web performance insights with additional metrics and enhanced Visually complete for synthetic monitors

Dynatrace

Dynatrace Synthetic Monitoring allows you to proactively monitor the availability of your public as well as your internal web applications and API endpoints from locations around the globe or important internal locations such as branch offices. Synthetic monitors help you find issues before they affect your customers.

Metrics 220
article thumbnail

OpenTelemetry services analysis and endpoint detection made easier with Dynatrace unified services

Dynatrace

Great news: OpenTelemetry endpoint detection, analyzing OpenTelemetry services, and visualizing Istio service mesh metrics just got easier. As a CNCF open source incubating project, OpenTelemetry provides a standardized set of APIs, libraries, agents, instrumentation, and specifications for logging, metrics, and tracing.

Metrics 171
article thumbnail

Boost application performance with improved CPU analysis across all your deep-monitored workloads

Dynatrace

We’re happy to announce that with Dynatrace version 1.198, we’ve dramatically improved CPU analysis, allowing you to easily understand CPU consumption over time, in the context of your workloads. All deeper analysis actions are performed across the entire timeframe. Fully automated code-level visibility.