Remove Analysis Remove Availability Remove Metrics Remove Performance
article thumbnail

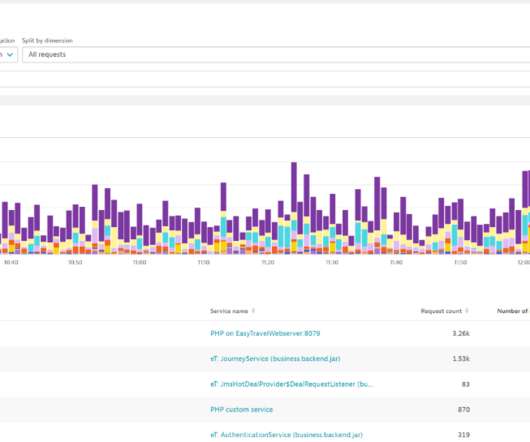
OpenTelemetry services analysis and endpoint detection made easier with Dynatrace unified services

Dynatrace

Great news: OpenTelemetry endpoint detection, analyzing OpenTelemetry services, and visualizing Istio service mesh metrics just got easier. As a CNCF open source incubating project, OpenTelemetry provides a standardized set of APIs, libraries, agents, instrumentation, and specifications for logging, metrics, and tracing.

Metrics 171
article thumbnail

Dynatrace simplifies OpenTelemetry metric collection for context-aware AI analytics

Dynatrace

The release candidate of OpenTelemetry metrics was announced earlier this year at Kubecon in Valencia, Spain. Since then, organizations have embraced OTLP as an all-in-one protocol for observability signals, including metrics, traces, and logs, which will also gain Dynatrace support in early 2023.

Analytics 286
Insiders

Sign Up for our Newsletter

This site is protected by reCAPTCHA and the Google Privacy Policy and Terms of Service apply.

Trending Sources

article thumbnail

Automated Change Impact Analysis with Site Reliability Guardian

Dynatrace

SREs use Service-Level Indicators (SLI) to see the complete picture of service availability, latency, performance, and capacity across various systems, especially revenue-critical systems. Additionally, you can easily use any previously defined metrics and SLOs from your environments.

DevOps 224
article thumbnail

Unmatched scalability and security of Dynatrace extensions now available for all supported technologies: 7 reasons to migrate your JMX and Python plugins

Dynatrace

address these limitations and brings new monitoring and analytical capabilities that weren’t available to Extensions 1.0: address these limitations and brings new monitoring and analytical capabilities that weren’t available to Extensions 1.0: Comprehensive metrics support Extensions 2.0 available, and more are in the pipeline.

article thumbnail

Any analysis, any time: Dynatrace Log Management and Analytics powered by Grail

Dynatrace

Limited data availability constrains value creation. Still, it is critical to collect, store, and make easily accessible these massive amounts of log data for analysis. Even in cases where all data is available, new challenges can arise. Current analytics tools are fragmented and lack context for meaningful analysis.

Analytics 240
article thumbnail

Multidimensional analysis 2.0: Analyze, chart, and report on microservices-based metrics without code changes

Dynatrace

In an existing application landscape, however, it can be difficult to get to those metrics. Dynatrace customers have the ability to leverage PurePath distributed tracing functionality in driving adhoc multidimensional analysis (MDA) on any kind of data available within their microservices. Here’s how Dynatrace customers do it.

Metrics 161
article thumbnail

Crucial Redis Monitoring Metrics You Must Watch

Scalegrid

Redis® is an in-memory database that provides blazingly fast performance. This makes it a compelling alternative to disk-based databases when performance is a concern. You might already use ScaleGrid hosting for Redis hosting to power your performance-sensitive applications.

Metrics 130