Remove 2020 Remove Availability Remove Metrics Remove Monitoring
article thumbnail

Partner Viewpoint: 2020 Gartner Magic Quadrant for APM & 2020 Critical Capabilities for APM

Dynatrace

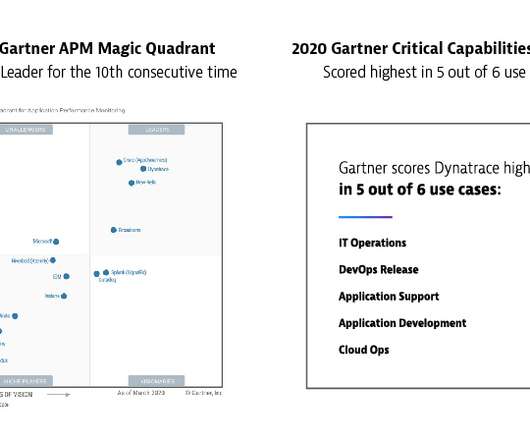
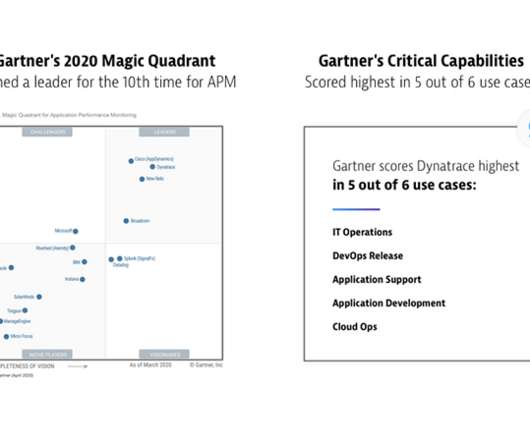
Following the release of Gartner’s 2020 Magic Quadrant for Application Performance Monitoring (APM) , and 2020 Gartner Critical Capabilities for APM report , I wanted to share my perspective on what these reports mean for our partners. Dynatrace news. Want to learn more?

Energy 139
article thumbnail

Dynatrace named a Leader in 2020 Gartner?Magic Quadrant for APM – positioned furthest for Completeness of Vision; scored highest in 5 of 6 Critical Capabilities use cases

Dynatrace

Gartner just released its latest Magic Quadrant for Application Performance Monitoring (APM) , and a separate Critical Capabilities for APM report. The Gartner document is available upon request from Dynatrace LLC. . Gartner, Magic Quadrant for Application Performance Monitoring, Charley Rich, Federico De Silva, 22 April 2020.

DevOps 242
Insiders

Sign Up for our Newsletter

This site is protected by reCAPTCHA and the Google Privacy Policy and Terms of Service apply.

Trending Sources

article thumbnail

The new normal of digital experience delivery – lessons learned from monitoring mission-critical websites during COVID-19

Dynatrace

Monitoring with ?the Readers who share our privacy concerns, please note, all the data we monitor is publicly available. . The insights in this b log rely heavily on data captured by Dynatrace’s proactive synthetic monitoring capabilities. We ’ve also been monitoring U. the Dynatrace®? seconds to 2.78

Website 214
article thumbnail

Dynatrace Managed release notes version 1.200

Dynatrace

Premium High Availability and Mainframe monitoring on IBM z/OS licenses are now displayed on the Licensing page. Synthetic monitoring. Displaying availability on the Synthetic monitors page. Displaying availability on the Synthetic monitors page. Synthetic monitoring. Synthetic monitoring.

Azure 243
article thumbnail

Making Ops Life Easier: Automating SLA Monitoring for Deployed Services on Kubernetes

Dynatrace

While this is a key capability, as k8s will restart pods that are unhealthy, it doesn’t guarantee that services exposed via Ingress are also available and responding within your SLAs to those that rely on these services: your end-users or service consumers outside k8s that call your services. high failure rate or unavailability.

article thumbnail

Bringing AV1 Streaming to Netflix Members’ TVs

The Netflix TechBlog

In February 2020, Netflix started streaming AV1 to the Android mobile app. Throughout 2020 the industry made impressive progress on AV1 hardware solutions. Challenge 4: How do we continuously monitor AV1 streaming? These dashboards allow us to monitor and analyze trends over time as members stream AV1.

Media 246
article thumbnail

Kubernetes: Challenges for observability platforms

Dynatrace

Typically, Kubernetes monitoring is managed using a separate dashboard (like the Kubernetes Dashboard or the Grafana App for Kubernetes ) that shows the state of the cluster and alerts when anomalies occur. To protect yourself from this, you want to instrument your application to provide deep monitoring insights.