Remove platform server-monitoring
article thumbnail

Driving your FinOps strategy with observability best practices

Dynatrace

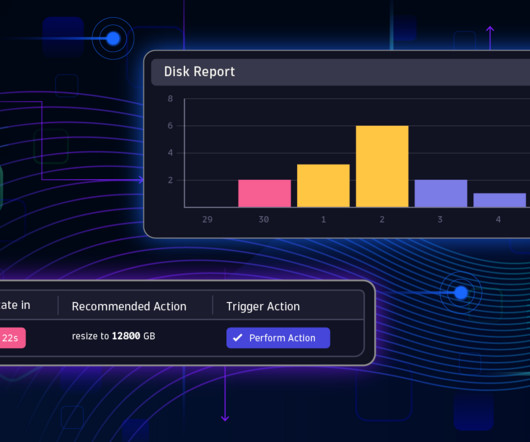
Empowering teams to manage their FinOps practices, however, requires teams to have access to reliable multicloud monitoring and analysis data. Cloud vendors often charge data egress fees when data shifts from their platforms or between regions. You can then start pulling that information into the observability platform.

article thumbnail

Enable full observability for Linux on IBM Z mainframe now with logs

Dynatrace

Mainframe is a strong choice for hybrid cloud, but it brings observability challenges IBM Z is a mainframe computing platform chosen by many organizations with a hybrid cloud strategy because of its security, resiliency, performance, scalability, and sustainability. This makes your log collection policies much more effective and transparent.

Insiders

Sign Up for our Newsletter

This site is protected by reCAPTCHA and the Google Privacy Policy and Terms of Service apply.

Trending Sources

article thumbnail

Dynatrace extends AI-powered observability for SAP together with PowerConnect

Dynatrace

Monitoring SAP products can present challenges Monitoring SAP systems can be challenging due to the inherent complexity of using different technologies—such as ABAP, Java, and cloud offerings—and the sheer amount of generated data. This is why Dynatrace is extending its observability capabilities for SAP with PowerConnect for SAP.

Java 188
article thumbnail

Automate your work with unified observability and custom solutions

Dynatrace

Increasingly, organizations are exploring unified software platforms that eliminate data silos while offering both flexibility and extensibility to safeguard their investments and streamline their diverse tools. Business process monitoring: Create custom dashboards for business process monitoring and trigger automated remediation actions.

AWS 220
article thumbnail

Dynatrace supports Amazon Linux 2023 as an AWS launch partner

Dynatrace

The Dynatrace Software Intelligence Platform accelerates cloud operations, helping organizations achieve service-level objectives (SLOs) with automated intelligence and unmatched scalability. Auto-detection starts monitoring new virtual machines as they are deployed. How does Dynatrace help?

AWS 281
article thumbnail

Introduction to Grafana, Prometheus, and Zabbix

DZone

It can query those metrics, send alerts, and can be actively used for monitoring and observability, making it a popular tool for gaining insights. Grafana is used widely these days to monitor and visualize the metrics for 100s or 1000s of servers, Kubernetes Platforms, Virtual Machines, Big Data Platforms, etc.

Big Data 161
article thumbnail

Unmatched scalability and security of Dynatrace extensions now available for all supported technologies: 7 reasons to migrate your JMX and Python plugins

Dynatrace

already address SNMP, WMI, SQL databases, and Prometheus technologies, serving the monitoring needs of hundreds of Dynatrace customers. JMX monitoring extensions are currently being migrated. is important Dynatrace extensibility is foundational to the technology coverage of the Dynatrace ® platform. Extensions 2.0 Extensions 2.0