article thumbnail

Building Netflix’s Distributed Tracing Infrastructure

The Netflix TechBlog

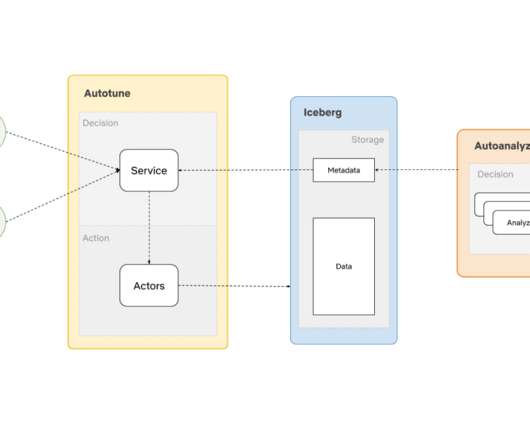
Now let’s look at how we designed the tracing infrastructure that powers Edgar. If we had an ID for each streaming session then distributed tracing could easily reconstruct session failure by providing service topology, retry and error tags, and latency measurements for all service calls.

article thumbnail

The Power of Caching: Boosting API Performance and Scalability

DZone

Caching is the process of storing frequently accessed data or resources in a temporary storage location, such as memory or disk, to improve retrieval speed and reduce the need for repetitive processing.

Cache 246
Insiders

Sign Up for our Newsletter

This site is protected by reCAPTCHA and the Google Privacy Policy and Terms of Service apply.

Trending Sources

article thumbnail

Get seamless insights into Nutanix clusters with Dynatrace

Dynatrace

By integrating Nutanix metrics into Dynatrace, you can gain valuable insights into the performance and health of your Nutanix infrastructure. Performance monitoring Dynatrace can collect performance metrics from Nutanix clusters, including latency, IOPS (Input/Output Operations Per Second), and network throughput.

article thumbnail

Optimize your environment: Unveiling Dynatrace Hyper-V extension for enhanced performance and efficient troubleshooting

Dynatrace

Secondly, determining the correct allocation of resources (CPU, memory, storage) to each virtual machine to ensure optimal performance without over-provisioning can be difficult. Firstly, managing virtual networks can be complex as networking in a virtual environment differs significantly from traditional networking.

article thumbnail

Managing risk for financial services: The secret to visibility and control during times of volatility

Dynatrace

Optimize the IT infrastructure supporting risk management processes and controls for maximum performance and resilience. The IT infrastructure, services, and applications that enable processes for risk management must perform optimally. Once teams solidify infrastructure and application performance, security is the subsequent priority.

Analytics 203
article thumbnail

Best practices and key metrics for improving mobile app performance

Dynatrace

This includes how quickly the application loads, how much load it is putting on the device, how much storage is being used, and how frequently it crashes. By monitoring metrics such as error rates, response times, and network latency, developers can identify trends and potential issues, so they don’t become critical. Issue remediation.

article thumbnail

Best MySQL DigitalOcean Performance – ScaleGrid vs. DigitalOcean Managed Databases

Scalegrid

Compare Latency. On average, ScaleGrid achieves almost 30% lower latency over DigitalOcean for the same deployment configurations. ScaleGrid provides 30% more storage on average vs. DigitalOcean for MySQL at the same affordable price. Read-Intensive Latency Benchmark. Balanced Workload Latency Benchmark.

Database 217