article thumbnail

Optimize your environment: Unveiling Dynatrace Hyper-V extension for enhanced performance and efficient troubleshooting

Dynatrace

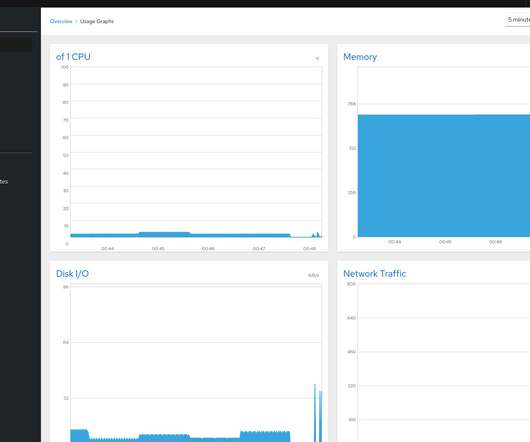
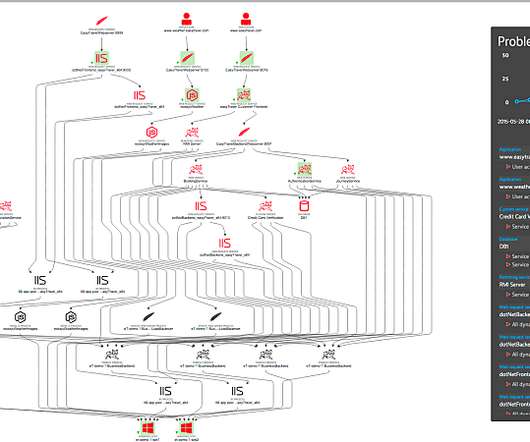
It enables multiple operating systems to run simultaneously on the same physical hardware and integrates closely with Windows-hosted services. Secondly, determining the correct allocation of resources (CPU, memory, storage) to each virtual machine to ensure optimal performance without over-provisioning can be difficult.

article thumbnail

Crucial Redis Monitoring Metrics You Must Watch

Scalegrid

RedisĀ® is an in-memory database that provides blazingly fast performance. This makes it a compelling alternative to disk-based databases when performance is a concern. You might already use ScaleGrid hosting for Redis hosting to power your performance-sensitive applications.

Metrics 130
Insiders

Sign Up for our Newsletter

This site is protected by reCAPTCHA and the Google Privacy Policy and Terms of Service apply.

Trending Sources

article thumbnail

Mastering Kubernetes deployments with Keptn: a comprehensive guide to enhanced visibility

Dynatrace

Numerous hurdles can hinder successful deployments, from resource constraints to external dependencies and monitoring inadequacies. Infrastructure health The underlying infrastructure’s health directly impacts application availability and performance. Ensuring that your monitoring solution monitors your cluster.

article thumbnail

Monitor Your Servers With Cockpit

DZone

Run your own Video Conference Service with Jitsi , I started looking for a reliable solution to monitor my instance that runs Jitsi. I needed basic information on RAM, CPU, Disk, Networking, and I/O to assess the performance bottleneck for the serve. Following on my previous article.

article thumbnail

What is a message queue? How an observability platform eases message queue monitoring

Dynatrace

It provides a consistent platform that integrates with a variety of message queuing types to enable consistent performance regardless of the platform. This approach is common in transaction-intensive environments in which teams perform the same tasks repetitively. Two styles of message queuing.

article thumbnail

Accelerate observability with Dynatrace Managed performance improvements

Dynatrace

There’s no other competing software that can provide this level of value with minimum effort and optimal hardware utilization that can scale up to web-scale! We’re continuously investing in performance optimizations, high availability, and resilience for Dynatrace Managed deployments. Support for high memory instances.