Remove explore
article thumbnail

Observability Pillars: Exploring Logs, Metrics and Traces

DZone

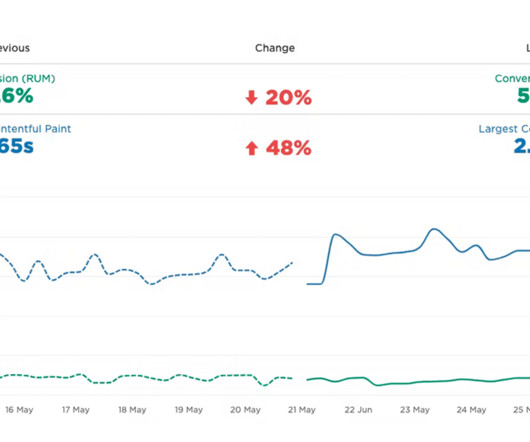
In the next few sections, we'll take a closer look at the three pillars of Observability: Metrics, Logs, and Traces. You can use the data from Observability to identify and troubleshoot problems, optimize performance, and improve security.

Metrics 109
article thumbnail

Support ending for MS Internet Explorer versions 7-10, and older JavaScript frameworks

Dynatrace

Microsoft support for Internet Explorer 10 ended on January 31, 2020. Dynatrace will end support for Internet Explorer 10 and earlier versions in May 2023 with the release of RUM JavaScript version 1.265 and Dynatrace version 1.266. Dynatrace will continue providing security updates as and when necessary during normal support cycle.

Internet 203
Insiders

Sign Up for our Newsletter

This site is protected by reCAPTCHA and the Google Privacy Policy and Terms of Service apply.

Trending Sources

article thumbnail

Dynatrace simplifies OpenTelemetry metric collection for context-aware AI analytics

Dynatrace

The release candidate of OpenTelemetry metrics was announced earlier this year at Kubecon in Valencia, Spain. Since then, organizations have embraced OTLP as an all-in-one protocol for observability signals, including metrics, traces, and logs, which will also gain Dynatrace support in early 2023. The exploration is complete.

Analytics 276
article thumbnail

Support of OpenTelemetry metrics with enhanced AI capabilities

Dynatrace

With the most important components becoming release candidates , Dynatrace now supports the full OpenTelemetry specification on all runtimes and automatically adds intelligence to metrics at enterprise scale. So these metrics are immensely valuable to SRE and DevOps teams. Automation and intelligence for metrics at enterprise scale.

Metrics 225
article thumbnail

Extract metrics from business events to increase the value of business analytics

Dynatrace

This is achieved, in part, by establishing actionable statistical accuracy —not necessarily precise accuracy —through practical levels of metric sampling, aggregation, and extrapolation. Introducing metric extraction from business events Beginning with Dynatrace SaaS version 1.257, you can extract metrics from ingested business events.

Analytics 197
article thumbnail

How to collect Prometheus metrics in Dynatrace

Dynatrace

Dynatrace has recently extended its Kubernetes operator by adding a new feature, the Prometheus OpenMetrics Ingest , which enables you to import Prometheus metrics in Dynatrace and build SLO and anomaly detection dashboards with Prometheus data. Here we’ll explore how to collect Prometheus metrics and what you can achieve with them.

Metrics 197
article thumbnail

Exploring OpenTelemetry Capabilities

DZone

This data can take the form of logs, metrics, and Disturbed Traces. It is impossible to know with certainty what is happening inside a remote or distributed system, even if they are running on a local machine. Telemetry is precisely what provides all the information about the internal processes.

Metrics 130