article thumbnail

What is observability? Not just logs, metrics and traces

Dynatrace

In IT and cloud computing, observability is the ability to measure a system’s current state based on the data it generates, such as logs, metrics, and traces. If you’ve read about observability, you likely know that collecting the measurements of logs, metrics, and distributed traces are the three key pillars to achieving success.

Metrics 363
article thumbnail

Go big with Dynatrace: Native support for large log records

Dynatrace

Download our free eBook to learn how Dynatrace helps its retail customers. With Dynatrace, our customer now leverages OneAgent to automatically collect all log records, signals, and metrics. Therefore, they were blocked from accessing certain events, metrics, and meaningful analysis. Ready to go big?

Retail 187
Insiders

Sign Up for our Newsletter

This site is protected by reCAPTCHA and the Google Privacy Policy and Terms of Service apply.

article thumbnail

Digital first, and always: Five critical metrics for measuring customer experience at federal agencies

Dynatrace

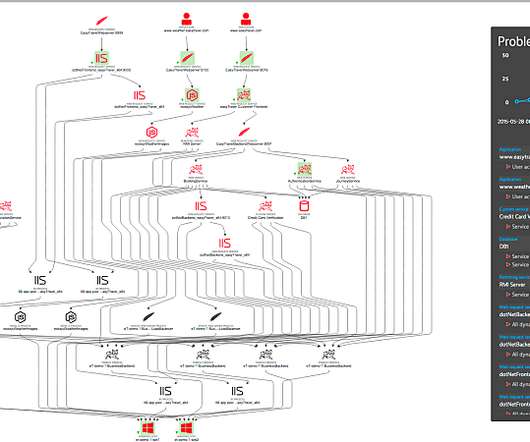
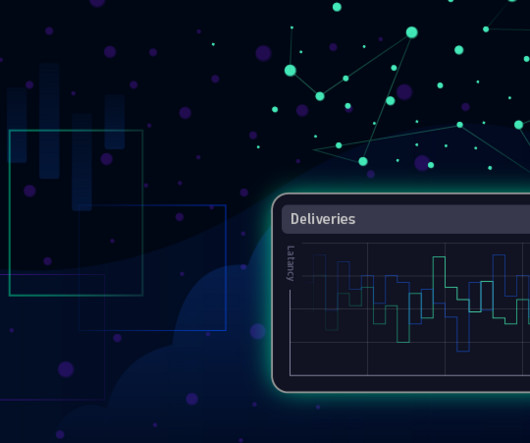
The five key metrics to improve customer satisfaction To help turn this around, Dynatrace makes available its unified observability platform, which captures all CX interactions and transactions in an automated, intelligent manner – including user session replays. When combined, key metrics will generate an accurate CX index score.

Metrics 246
article thumbnail

What is? OpenTelemetry??An open-source standard for logs, metrics, and traces

Dynatrace

Loosely defined, observability is the ability to understand what’s happening inside a system from the knowledge of the external data it produces, which are usually logs, metrics, and traces. Logs, metrics, and traces make up the bulk of all telemetry data. Read eBook now! What happened to OpenTracing and OpenCensus?

article thumbnail

Observability vs. monitoring: What’s the difference?

Dynatrace

Monitoring focuses on watching specific metrics. Observability is the ability to understand a system’s internal state by analyzing the data it generates, such as logs, metrics, and traces. For example, we can actively watch a single metric for changes that indicate a problem — this is monitoring.

article thumbnail

What is cloud monitoring? How to improve your full-stack visibility

Dynatrace

These next-generation cloud monitoring tools present reports — including metrics, performance, and incident detection — visually via dashboards. This type of monitoring tracks metrics and insights on server CPU, memory, and network health, as well as hosts, containers, and serverless functions. Cloud monitoring types and how they work.

Cloud 295
article thumbnail

What is full stack observability?

Dynatrace

A full-stack observability solution uses telemetry data such as logs, metrics, and traces to give IT teams insight into application, infrastructure, and UX performance. Check out the on-demand Power Demo, Dynatrace and Business Observability: Tying IT Metrics to Business Outcomes. See observability in action! Watch webinar now!

DevOps 303