Remove Database Remove Java Remove Metrics Remove Monitoring
article thumbnail

Automatic and intelligent end-to-end observability for OpenTelemetry Java

Dynatrace

Today, Dynatrace is happy to announce OneAgent support for discovering and automatically capturing OpenTelemetry trace data for Java. PurePath integrates OpenTelemetry Java data for enterprise-grade collection and contextual analytics. Enriching local monitoring data with project-specific additions.

Java 157
article thumbnail

Unmatched scalability and security of Dynatrace extensions now available for all supported technologies: 7 reasons to migrate your JMX and Python plugins

Dynatrace

already address SNMP, WMI, SQL databases, and Prometheus technologies, serving the monitoring needs of hundreds of Dynatrace customers. JMX monitoring extensions are currently being migrated. Extensions can monitor virtually any type of technology in your environment. Comprehensive metrics support Extensions 2.0

Insiders

Sign Up for our Newsletter

This site is protected by reCAPTCHA and the Google Privacy Policy and Terms of Service apply.

Trending Sources

article thumbnail

Transform mainframe applications into z/OS Java services with end-to-end transaction visibility and anomaly detection (Preview)

Dynatrace

Although these COBOL applications operate with consistent performance, companies and governments are forced to transform them to new platforms and rewrite them in modern programming languages (like Java) for several reasons. Thus, implementing applications in Java can result in considerable financial savings.

Java 180
article thumbnail

What is? OpenTelemetry??An open-source standard for logs, metrics, and traces

Dynatrace

Loosely defined, observability is the ability to understand what’s happening inside a system from the knowledge of the external data it produces, which are usually logs, metrics, and traces. Monitoring begins here. Logs, metrics, and traces make up the bulk of all telemetry data. Span ingestion.

article thumbnail

Boost application performance with improved CPU analysis across all your deep-monitored workloads

Dynatrace

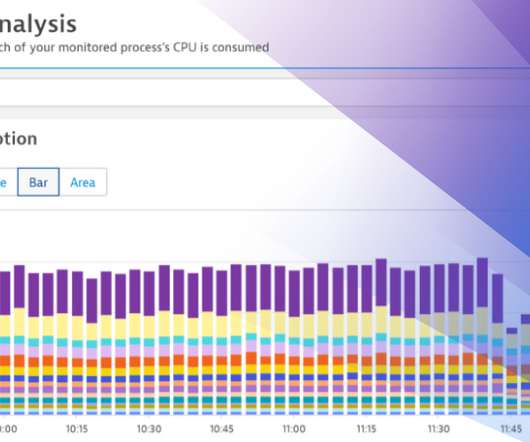
Apart from its best-in-class observability capabilities like distributed traces, metrics, and logs, Dynatrace OneAgent additionally provides automatic deep code-level insights for Java,NET, Node.js, PHP, and Golang, without the need to change any application code or configuration. Fully automated code-level visibility.

article thumbnail

A guide to Autonomous Performance Optimization

Dynatrace

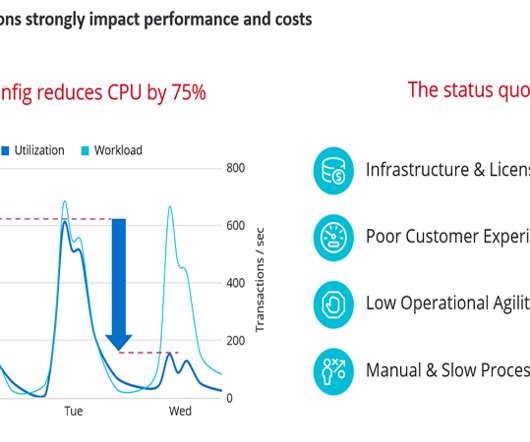
Stefano started his presentation by showing how much cost and performance optimization is possible when knowing how to properly configure your application runtimes, databases, or cloud environments: Correct configuration of JVM parameters can save up to 75% resource utilization while delivering same or better performance!

article thumbnail

Data Reprocessing Pipeline in Asset Management Platform @Netflix

The Netflix TechBlog

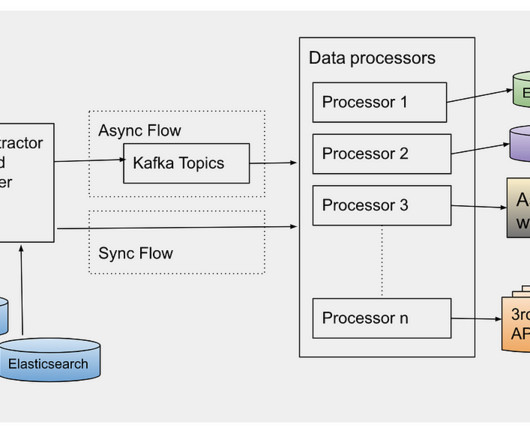
Production Use Cases Real-Time APIs (backed by the Cassandra database) for asset metadata access don’t fit analytics use cases by data science or machine learning teams. For fast processing of the events, we use different settings of Kafka consumer and Java executor thread pool.

Media 237