article thumbnail

2023 Black Friday and Cyber Monday retail and e-commerce IT performance observations

Dynatrace

Over the years, I have watched and written about online retail and e-commerce IT performance. What I have seen is a maturing of the online retail channels when it comes to delivering customer experiences. This year we saw few, if any, major issues with online retailers.

Retail 221
article thumbnail

Understanding the performance impact of anti-flicker snippets

Speed Curve

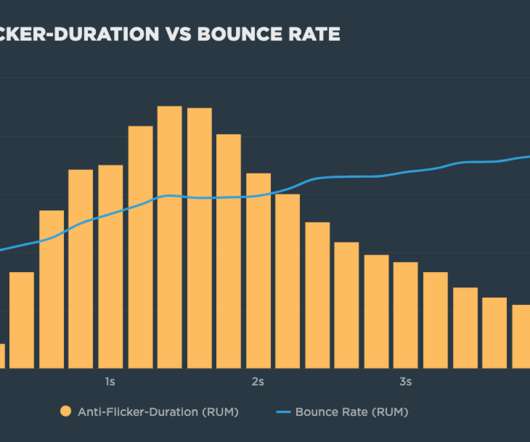
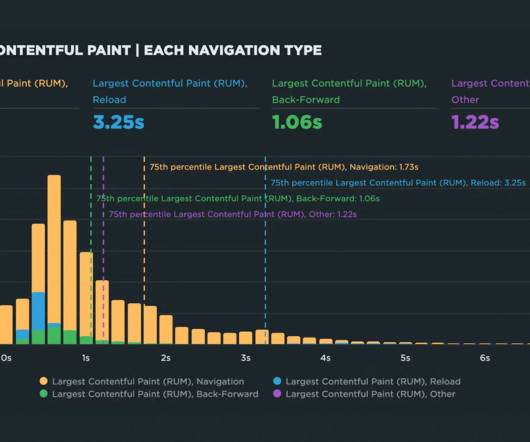
But this practice comes with some performance measurement pitfalls: Hiding the contents of the page can have a dramatic effect on the Web Vitals that measure visual experience, such as First Contentful Paint (FCP) and Largest Contentful Paint (LCP). Update the Optimize anti-flicker snippet to include performance marks and measures.

Insiders

Sign Up for our Newsletter

This site is protected by reCAPTCHA and the Google Privacy Policy and Terms of Service apply.

Trending Sources

article thumbnail

Retailers Still Fail to Prepare Their Websites for Holiday Shoppers

Dotcom-Montior

Retailers Still Fail to Prepare Websites for Holiday Shoppers Monitoring of Retailer’s Websites during Black Friday holiday shopping. Black Friday is one of the most valuable times for retailers across the world because buyers shop until they drop. Measured start page load time of leading Retailers websites. The Setup.

Retail 40
article thumbnail

Kubernetes in the wild report 2023

Dynatrace

The study analyzes factual Kubernetes production data from thousands of organizations worldwide that are using the Dynatrace Software Intelligence Platform to keep their Kubernetes clusters secure, healthy, and high performing. In comparison, on-premises clusters have more and larger nodes: on average, 9 nodes with 32 to 64 GB of memory.

article thumbnail

2022 in review: New dashboards, Core Web Vitals enhancements, third-party tracking & more!

Speed Curve

we also: Launched a series of new and improved dashboards to help you identify and fix your performance issues more quickly and efficiently (More on those below.). Your Home dashboard brings together your Synthetic and RUM data to provide an easy-to-digest – and easy-to-share – snapshot of how your site is performing.

article thumbnail

How Target.com Could Make Their Site 3.1s Faster

MachMetrics

Target is one of the most well-known retailers around, and they’ve recently increased their focus on the e-commerce portion of their business – Target.com. In fact, they just cracked into the top 10 list of US e-commerce retailers. You can check out a comparison of their hosting to Walmart.com here. This is a lot.

Retail 82
article thumbnail

NEW: Compare ALL the things!

Speed Curve

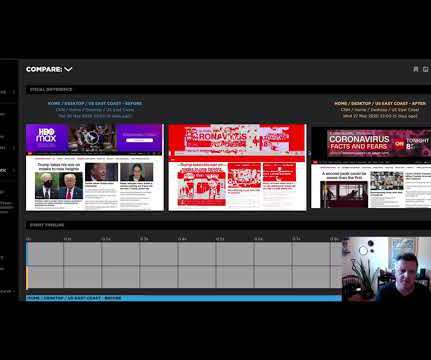
One of the huge benefits of tracking web performance over time is the ability to see trends and compare metrics. With the new 'Compare' feature, you can now generate side-by-side comparisons that let you not only spot regressions, but easily identify what caused them: Compare the same page at different points in time. Test case: CNN.

Metrics 62