Remove Benchmarking Remove Comparison Remove Performance Remove Retail
article thumbnail

2023 Black Friday and Cyber Monday retail and e-commerce IT performance observations

Dynatrace

Over the years, I have watched and written about online retail and e-commerce IT performance. What I have seen is a maturing of the online retail channels when it comes to delivering customer experiences. This year we saw few, if any, major issues with online retailers.

Retail 217
article thumbnail

2022 in review: New dashboards, Core Web Vitals enhancements, third-party tracking & more!

Speed Curve

we also: Launched a series of new and improved dashboards to help you identify and fix your performance issues more quickly and efficiently (More on those below.). Your Home dashboard brings together your Synthetic and RUM data to provide an easy-to-digest – and easy-to-share – snapshot of how your site is performing.

Insiders

Sign Up for our Newsletter

This site is protected by reCAPTCHA and the Google Privacy Policy and Terms of Service apply.

Trending Sources

article thumbnail

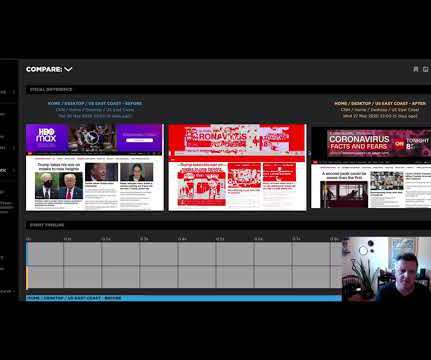
NEW: Compare ALL the things!

Speed Curve

One of the huge benefits of tracking web performance over time is the ability to see trends and compare metrics. With the new 'Compare' feature, you can now generate side-by-side comparisons that let you not only spot regressions, but easily identify what caused them: Compare the same page at different points in time. Test case: CNN.

Metrics 61
article thumbnail

Stuff The Internet Says On Scalability For September 7th, 2018

High Scalability

Retail: $20 trillion. Of course, in some cases the difference to performance is small enough that one can live with it, but it’s often bad enough to be a problem. We fairly frequently see performance get 5% or more worse over time in a single process execution. They'll love you even more. Cars: $1 trillion.

Internet 137