Remove Cloud Remove Document Remove Metrics Remove Tuning
article thumbnail

Automate complex metric-related use cases with the Metrics API version 2

Dynatrace

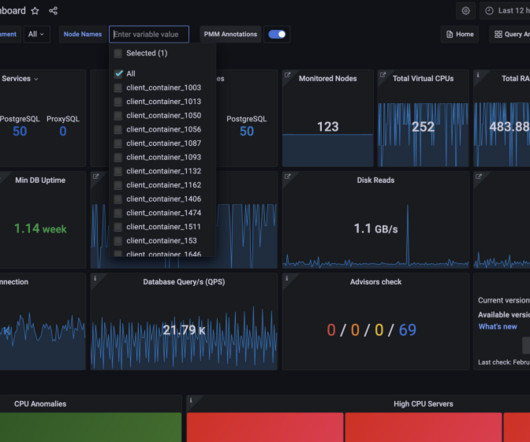
Dynatrace collects a huge number of metrics for each OneAgent-monitored host in your environment. Depending on the types of technologies you’re running on individual hosts, the average number of metrics is about 500 per computational node. Running metric queries on a subset of entities for live monitoring and system overviews.

Metrics 231
article thumbnail

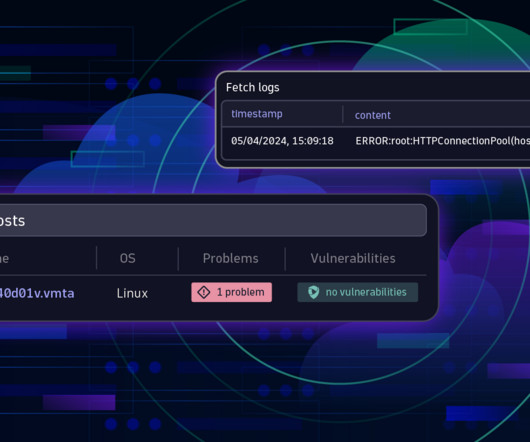
Accelerate your cloud journey with Dynatrace observability for AWS S3 logs

Dynatrace

Logs complement metrics and enable automation Cloud practitioners agree that observability, security, and automation go hand in hand. The increasing complexity of cloud service architectures requires a rock-solid understanding of the activity, health status, and security of cloud services.

AWS 203
Insiders

Sign Up for our Newsletter

This site is protected by reCAPTCHA and the Google Privacy Policy and Terms of Service apply.

Trending Sources

article thumbnail

Enable full observability for Linux on IBM Z mainframe now with logs

Dynatrace

Mainframe is a strong choice for hybrid cloud, but it brings observability challenges IBM Z is a mainframe computing platform chosen by many organizations with a hybrid cloud strategy because of its security, resiliency, performance, scalability, and sustainability.

article thumbnail

What is cloud-native architecture? Set yourself up for cloud success

Dynatrace

Lifting and shifting applications from the data center to the cloud delivers only marginal benefits. Because cloud computing breaks application functions into many microservices, porting monolithic applications to the cloud unchanged can slow them down. So, what is cloud-native architecture, exactly? Declarative APIs.

Cloud 162
article thumbnail

Flexible, scalable, self-service Kubernetes native observability now in General Availability

Dynatrace

Dynatrace Cloud Native Full Stack injection for Kubernetes, now officially released, provides unparalleled flexibility and scale for onboarding teams to AI-powered observability. From a cost perspective, internal customers waste valuable time sending tickets to operations teams asking for metrics, logs, and traces to be enabled.

article thumbnail

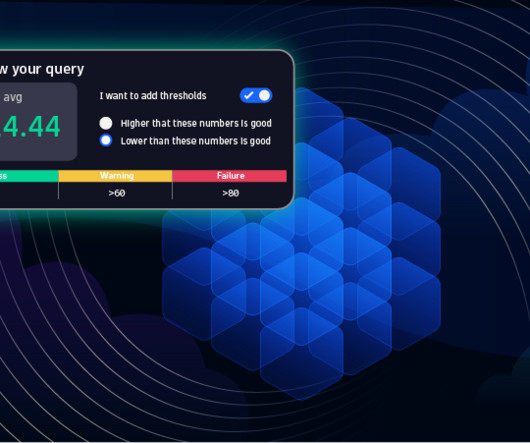
Dynatrace innovates again with the release of topology-driven auto-adaptive metric baselines

Dynatrace

With the advent and ingestion of thousands of custom metrics into Dynatrace, we’ve once again pushed the boundaries of automatic, AI-based root cause analysis with the introduction of auto-adaptive baselines as a foundational concept for Dynatrace topology-driven timeseries measurements. In many cases, metric behavior changes over time.

Metrics 215
article thumbnail

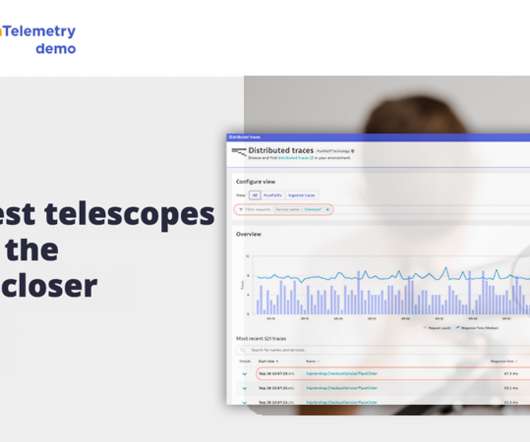
OpenTelemetry services analysis and endpoint detection made easier with Dynatrace unified services

Dynatrace

Great news: OpenTelemetry endpoint detection, analyzing OpenTelemetry services, and visualizing Istio service mesh metrics just got easier. As a CNCF open source incubating project, OpenTelemetry provides a standardized set of APIs, libraries, agents, instrumentation, and specifications for logging, metrics, and tracing.

Metrics 171